

Uncovering the Essentials: A Guide to Behavioral Product Analytics Metrics

Once upon a time, there was a John.
John was that entrepreneur who had created that perfect product.
It was innovative, versatile and offered users an incredibly fluid experience.
Despite all this, he could never quite figure out why their product wasn’t as successful as he had hoped it would be.
He Kept asking questions “why is that so?” instead of “what to do to change it?”.
Sounds like you’re a John, a little? Well, you don’t have to be one (sorry Johns!) – if you delve into behavioral product analytics metrics.
Behavioral product analytics metrics encompass a range of data points that can give you valuable insight into user behavior.
And today, we’ll bring these essentials to light, including a range of topics product teams might need to pencil in when getting started.
What are Behavioral Product Analytics Metrics
Behavioral product analytics metrics provide an in-depth look into how users interact with a product. Through these metrics, you can identify user behaviors and trends, helping you to make more informed decisions about your product and improve customer experience.
Benefits of Using Behavioral Product Analytics Metrics
Actionable Insights into Platform Performance and Optimization Opportunities
Behavioral product analytics metrics offer key insights into your business performance.
With user behavior metrics, you can gain an understanding of how users engage with your product and how you can further optimize the user experience.
Usage frequency, retention rates and engagement rates are just a few examples of the data points available to you that can inform actionable decisions. Further, those can improve platform performance in measurable ways.
By leveraging these metrics, you can gain valuable insight into potential optimization opportunities and drive better outcomes for your users in the process.
Let’s assume that you want to improve the user experience on your product.
Thanks to taking a closer look at behavioral product analytics metrics (e.g. product usage frequency, session length), you can gain an understanding of how users engage with the product.
This way, you make more informed decisions about improvements and drive better outcomes for your users.
For example, say that you notice that usage frequency is low or declining.
With this insight, you can explore potential solutions to improve the user experience and increase usage frequency. This could be introducing new features that make the product more enjoyable to use. Or providing incentives for users who interact with the product regularly.
Improved Understanding of User Behavior and Preferences
It’s no easy catch when it comes to understanding user behavior.
Identifying and responding to user preferences is a key element of product success. But without the right insights, this can be difficult.
Behavioral analytics metrics provide a window into user behavior, helping you understand what drives users to engage with your product. And also how you can best meet their needs.
And while you cannot change user behavior overnight, you can use this data to understand users better. What’s more, it’ll be easier to make adjustments that will improve user experience over the long-term.
Starting by analyzing usage patterns and customer feedback, you can gain an understanding of what features customers want and how they prefer to interact with your product.
This knowledge empowers you to make data-driven decisions about feature updates and releases that will meet user needs.
Ultimately, this will lead to a more enjoyable experience for your users.
Better Alignment Between Marketing Team Goals and Digital Products
A huge pain point for many businesses is achieving alignment between marketing goals and product development.
Behavioral analytics metrics provide you with the insights to bridge this gap. This way, everyone from your engineering team through your analytics team to your marketing team can work towards a shared goal of improving user experience.
One team aims to drive more user engagement, while the other strives for product optimization. The latter applies to e.g., product development team.
With behavioral analytics metrics, you can understand how changes to your digital products affect user behavior and product over time.
Then, you can use that data to inform both teams’ strategies.
This provides a deeper understanding of customer needs - ultimately leading to better outcomes for everyone involved.
Since everyone is on the same page (with all aspects of the product functioning in harmony), you can create a more cohesive and impactful user experience.
And that just pays off.
Types of Behavioral Product Analytics Metrics
User Actions
Probably the most well-known type of behavioral product analytics metric: user actions.
It measures the types of interactions that users have with your product.
Analyzing this aspect can help you find answers to the most burning questions about your product, such as:
- What features or elements of the product are being used most?
- Are users taking certain actions more often than others?
- What steps do users take before completing a task with your product?
Activities within this area may include tracking page views, clicks, taps, swipes, and other user-initiated activities within an app or website.
But - it comes with a caveat: user actions don’t always tell the whole story.
Customer Experience
One that is often overlooked: customer experience metric.
It gives you A LOT of insight to understand how users feel while they interact with your product.
Through analyzing user sentiment and feedback, you can gain insights into the overall experiences of your customers - something that is priceless when it comes to improving the quality of a product or website.
Measuring customer experience per se can be quite difficult, which is why customer surveys and feedback forms are often used.
Again, they need to be designed in a way that can effectively collect useful data. Else, the metrics will turn out to be useless.

Conversion Rates
Delving further into the realm of analytics, conversion rates provide an insight into the effectiveness of your product. What does this mean? Well, you can find out what features are working, and which ones need to be improved or removed, and so on.
Note that conversion rates don’t just focus on monetary conversions (such as sales or sign-ups).
They can also measure how users interact with elements within your product, such as how effective a CTA is, or whether users are completing specific processes.
Examples are multiple.
For instance, if you’re running a mobile app, you may want to track how many users complete onboarding or transition from one step of the process/action to another.
Not only does this help you understand customer behavior, but it also helps you find out which product decisions could be streamlined.
From this moment on, it’s up to you to take the necessary action, improve product performance, and make sure conversion rates stay as high as possible.
Cohort Analysis
If you compare user data between two sets of users, you’ll usually find that they have similar patterns over time.
This is where cohort analysis comes in.
Cohort analysis allows you to group users based on common characteristics and monitor how these groups interact with your product or website over time.
It helps you identify trends and understand why certain groups may be performing better than others.
With analyzing cohorts, you can gain deeper insights into user behavior and uncover opportunities for improvement - an invaluable tool for any product owner or marketer.
Even though it might take some time to set up, cohort analysis can be a powerful tool for understanding the entire customer journey and making your customers… just happy customers.
Churn Rate
That one metric that keeps marketers up at night.
Churn rate (also known as attrition rate) measures the percentage of customers that stop using a product/service within a certain period of time.
In simple terms, if you have 100 users in one month and only 80 stayed with you after two months, your churn rate for those two months would be 20%.
These business metrics can help you understand user engagement with your product, and can often be used to develop strategies to reduce churn rates and increase user retention.
High churn rate, accompanied by a low customer retention rate, high bounce rates, and average revenue growth, could be an indication of poor user experience or a lack of features that users are looking for.
Active Users
You might have some users registered, but do they, actually, use your product? And if so, over what period of time?
Active users are those who interact with your product, complete tasks, or simply use it to consume content.
It’s one of the key metrics to measure the success of your product and understand the level of product engagement and usage patterns it has with its user base.
They mean a lot to product owners and help assess the effectiveness of marketing campaigns or other strategies.
The more active users you have, the better.
And the more active users you have that become loyal customers with a visibly longer customer lifetime period and low retention rate, the better.
Usage Frequency
Guaranteeing user engagement is the job of each product manager, and usage frequency can give you a good idea of whether users are using your product or not.
Measuring usage frequency does not mean only tracking clicks - that would be counterproductive for most products.
In fact, it involves more qualitative metrics, such as:
- how often users use or interact with the product,
- how much time they spend on it,
- how often they come back for more.
Usage frequency metrics can tell you a lot about user engagement and loyalty.
While these are not helicopter view product metrics like active users, they are more precise and give you a better idea of how people use your product.
The ultimate goal is to keep usage frequency as high as possible, in order to increase customer loyalty and engagement.
This can be done by introducing new features or updates, improving user experience, increasing retention rate, or simply providing better value for the users.
However, don’t forget to combine them with other metrics in order to get an accurate picture of the customer journey.
Feature Adoption
Creating features that users actually like and use is the holy grail of product development.
Feature adoption tells you how many users are actively using a feature or engaging with it.
Feature adoption should not be confused with usage frequency - the former measures how widely adopted a certain feature is, while the latter looks at how much people use it.
Feature adoption metrics can help you measure the success of new features and understand what users need in order for them to become loyal customers.
Measuring feature adoption can also help you identify which features should be removed or improved, so that you can focus your efforts on making your product even better.
And then, conducting customer interviews can expand the results of feature adoption surveys or research.

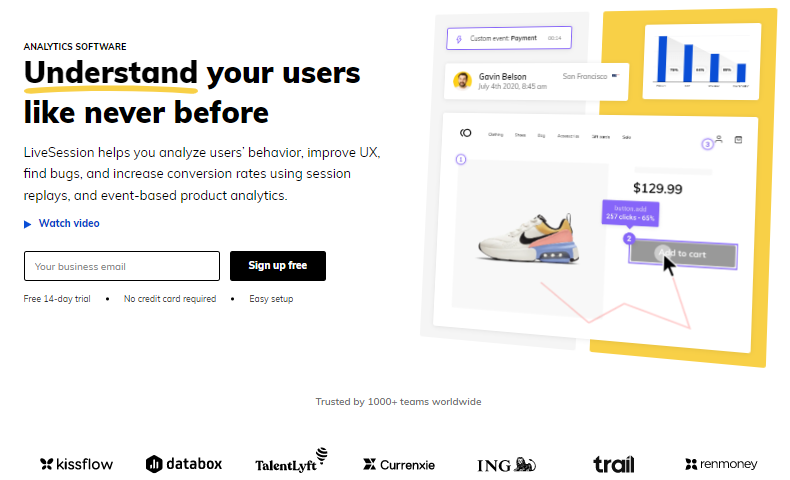
Tools Used in Collecting Behavioral Product Analytics Metrics: Here Comes LiveSession
LiveSession is one of these product analytics tools that help you to collect and analyze behavioral product analytics metrics with ease.
LiveSession enables you to view ongoing user sessions in real time or replay past sessions in order to gain valuable insights into how users interact with your product.
The powerful visual dashboard allows you to:
- see usage trends,
- find errors or bottlenecks quickly, and
- track user engagement metrics such as drop-off points.
All of this data can be used to evaluate how customers are responding to your product changes and identify areas where optimization opportunities exist.
The result?
You get actionable insights into exactly what needs improving upon.
#1 Leverage User Sessions
Recorded sessions are a valuable source of insights into user behaviour, and are one of the most powerful tools for both product and marketing analytics.
LiveSession enables you to record all user sessions and quickly play them back to gain an understanding of user journeys and how they interact with your product.
With our session recording feature, you can replay entire user visits in order to:
- analyze user navigation,
- identify drop-off points, and
- uncover areas of improvement.
This data can be used to make informed decisions (about product changes, marketing strategies, customer interactions, user segments, business goals, customer acquisition channel strategy etc.,), and optimize engagement.

Read more:
Website Session Recordings - Everything You Should Know
Session Replay Tools - Picking The Best One
#2 Capitalize on Click & Heat Maps
Analyzing results on scale is often like looking for a needle in a haystack.
With LiveSession’s click and heat maps, you can quickly identify hot spots or areas of interest and make data-driven decisions as to where to focus your efforts.
Click maps let you see exactly what users are clicking on while they’re using your product and which elements are not performing well.
Heat maps provide an overview of how users are navigating your product and identify the most popular sections or relevant features.
This data can be used to optimize user experience, prioritize product feature development or redesign elements that are not performing optimally.
Read more:
#3 Create and analyze your funnels (all way down)
What you see is not always what you get.
Having user sessions and heatmaps is awesome, but understanding the entire process from start to finish can be difficult.
LiveSession’s funnel analysis feature allows you to quickly identify drop-off points in your product journey and understand exactly how users are interacting with each step of the conversion funnel.
Funnel analysis gives you a clear view of what is working, what isn’t and which changes are needed to improve the user experience.
This data can be used to adjust page layouts or entire processes in order to optimize conversions and increase customer satisfaction – but these are only a few examples.

Get into that behaviour analysis, like, now!
Data is a new gold, so grab this opportunity to get insights into user behavior and experience with LiveSession.
Having an understanding of what your users do when they interact with your product can be a great source of information.
Product analytics platforms are there to help you with prioritizing a product roadmap. All this while having a complete picture of not only what, but how you’re doing, and running various types of analysis on data you already have.
The most successful companies are the ones who know how to leverage behavioral insights and analyze actions users take across their marketing channels.
It’s them who mastered lowering a customer acquisition cost and squeezing user interaction to the brim.
Is that about your business?
Start now - collect data, analyze results and optimize your product according to user needs.
Your new product analytics software is waiting for you.