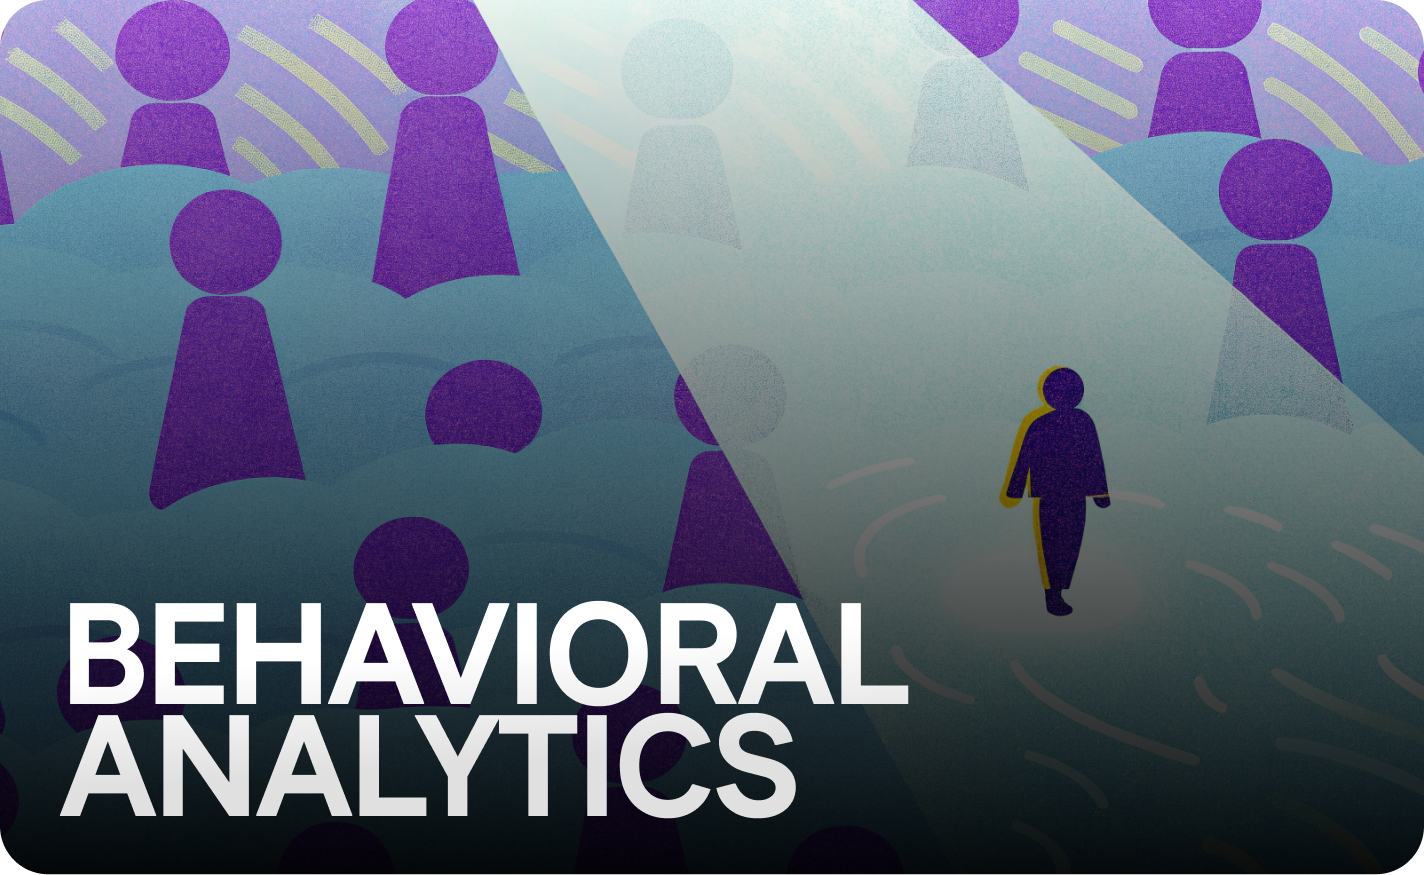
 Behavioral Analytics with Autocapture: Turning User Interactions into Actionable Product Insights
Behavioral Analytics with Autocapture: Turning User Interactions into Actionable Product Insights

Every click, scroll, hover, and hesitation tells a story about what your users are trying to accomplish and where your product gets in their way. Behavioral analytics is the discipline of reading that story at scale. When it is fed by autocaptured data, it stops being a guessing game and becomes a reliable engine for product decisions.
This article breaks down how behavioral analytics works, what behavioral data it relies on, and how pairing quantitative metrics with qualitative session replays turns raw user interactions into actionable insights. If you want the foundations of how events are recorded without manual instrumentation, see autocapture, the pillar this piece builds on.
What is behavioral analytics? (Understanding behavioral analytics)

The core definition. Behavioral analytics is the practice of collecting and interpreting how users actually move through a product. Instead of asking people what they did, it observes what they did capturing user actions as they happen and surfacing the patterns inside them.
Why it matters. Understanding behavioral analytics means accepting that intent lives in behavior, not in opinion. A user who abandons checkout three times in a row is communicating something a survey would never reveal. Behavioral analytics helps you hear it.
Where it sits. As a branch of product analytics, behavioral data analytics focuses on the in-product journey: onboarding, activation, feature adoption, and retention. It complements business analytics by explaining the "why" behind the numbers a dashboard reports.
How does behavioral analytics work?
Step one: capture. Behavioral analytics involves recording every meaningful interaction page views, clicks, form inputs, navigation, and rage clicks. With autocapture, this happens automatically, so you collect behavioral data without writing tracking code for each element. That breadth matters: you cannot analyze a pattern you never recorded.
Step two: structure. Raw data is then organized into sessions, funnels, and journeys. Analytics works by mapping individual user actions onto larger sequences, so a single tap becomes part of a measurable path from entry to goal.
Step three: interpret. Finally, behavioral analytics utilizes both aggregate metrics and individual replays to identify patterns. The aggregate tells you how many users dropped off; the replay tells you why.
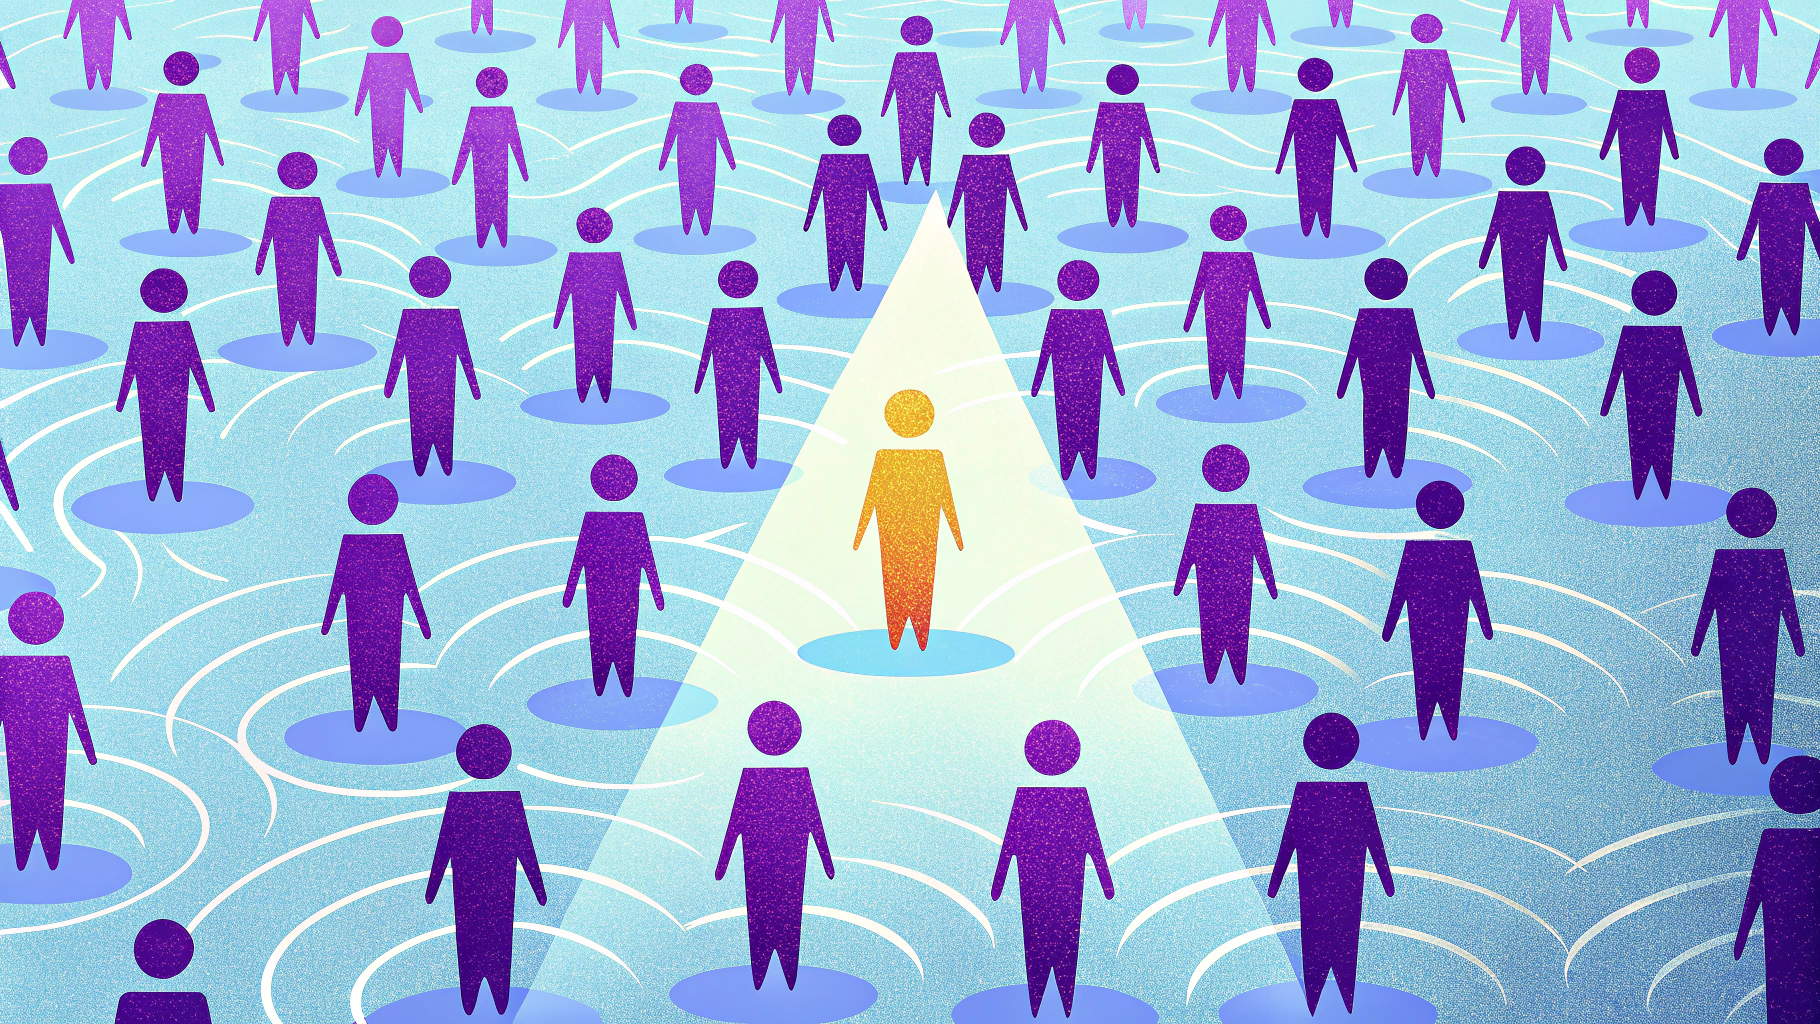
The reinforcing loop. Behavioral segmentation sorts users by their in-app actions to reveal patterns, and that segmentation becomes far sharper when it draws on autocaptured data because the behavioral baselines are built from complete activity, not a sampled subset.
What is the difference between behavioral analytics and behavioral analysis?
Analytics is the system. Behavioral analytics is the ongoing, instrumented process data collection, dashboards, and continuous monitoring that runs in the background of your product.
Analysis is the act. Behavioral analysis is the human-led investigation you perform on that data. Behavioral analysis allows a product team to ask a specific question "why are mobile users abandoning step two?" and dig into the replays and segments that answer it.
How they connect. Put simply: analytics gives you the always-on data layer; analysis is what you do with it when a question arises. Strong teams treat behavior analytics as the foundation and behavioral analysis as the recurring practice on top of it.
What behavioral data does behavioral analytics collect from user behavior?
Effective behavioral data analytics depends on breadth. The richest signal comes from combining many types of user behavior into one timeline. Autocapture-driven tools typically record:
- Clicks and taps including rage clicks, where rapid repeated clicking signals frustration with an unresponsive element.
- Navigation and page flow the routes users take, the back-button presses, and the dead ends.
- Scroll depth how far down a page attention actually reaches.
- Form interactions fields that get skipped, re-edited, or abandoned.
- Hovers and hesitations micro-signals of confusion or deliberation.
- Error encounters moments where the interface breaks the user's flow.
Quantity meets quality. Each of these data points is quantitative on its own, but together they reconstruct a qualitative experience. That combination is what separates behavioral analytics from a flat metrics report.
What are the main applications of behavioral analytics?
The applications of behavioral analytics span the entire product lifecycle. Behavioral analytics enables teams to:
- Optimize onboarding pinpoint the step where new users stall and remove the friction.
- Improve conversions find the exact field, button, or moment where checkout or signup breaks down.
- Validate feature rollouts measure whether a newly shipped feature is actually used the way it was designed to be.
- Personalize the experience tailor flows and messaging based on real behavioral segments rather than assumed personas.
A field-tested principle. AI can group session clips to uncover behavior patterns at scale, and these insights apply directly to onboarding, conversions, and feature rollouts exactly the use cases above. The point is consistent: behavioral analytics reveals where your product helps and where it hinders.
Customer journey clarity. By stitching user actions into a coherent customer journey, behavioral analytics provides the context product and marketing teams need to make data-driven decisions instead of relying on intuition.
How does behavioral analytics use AI and machine learning to identify patterns?
The scale problem. A growing product generates enormous amounts of data far more sessions than any analyst can watch. This is where AI earns its place in modern behavior analytics tools.
Clustering at scale. Machine learning models group similar sessions together, surfacing recurring patterns and anomalies that a human would miss in the noise. AI can cluster session clips to expose behavior patterns at scale, turning thousands of replays into a short list of meaningful segments worth reviewing.
Anomaly surfacing. AI is also adept at flagging anomaly behavior a sudden spike in rage clicks after a release, or an unexpected drop in funnel completion. Surfacing the anomaly automatically lets teams respond proactively rather than discovering the problem weeks later.
A light note on the broader field. The same pattern-detection techniques underpin behavioral analytics in cybersecurity, where security teams use behavioral baselines to flag anomalies that may indicate an insider threat or other cyber threats. The mechanics rhyme establish a baseline, detect deviation but for product teams the goal is user experience, not threat detection. Throughout this article the focus stays on the product application.
What should you look for in a behavioral analytics tool?
Not every behavioral analytics tool delivers the depth product teams need. When evaluating analytics solutions, prioritize the capabilities that turn data into decisions.
LiveSession was built specifically for this combination of breadth and depth. Look for:
- Autocapture by default recording user interactions without manual tagging, so no behavior slips through unmeasured.
- Session replay the ability to watch the real session behind any data point.
- Quantitative dashboards funnels, conversions, and segment metrics in one place.
- Rage click and error detection automatic flagging of frustration signals.
- Behavioral segmentation grouping users by what they do, not just who they are.
- Privacy controls masking sensitive fields so you can analyze behavior responsibly.
Why it matters. The best behavioral analytics systems unify these features so you never have to choose between the what and the why. LiveSession brings autocaptured metrics and replays together in one workflow.
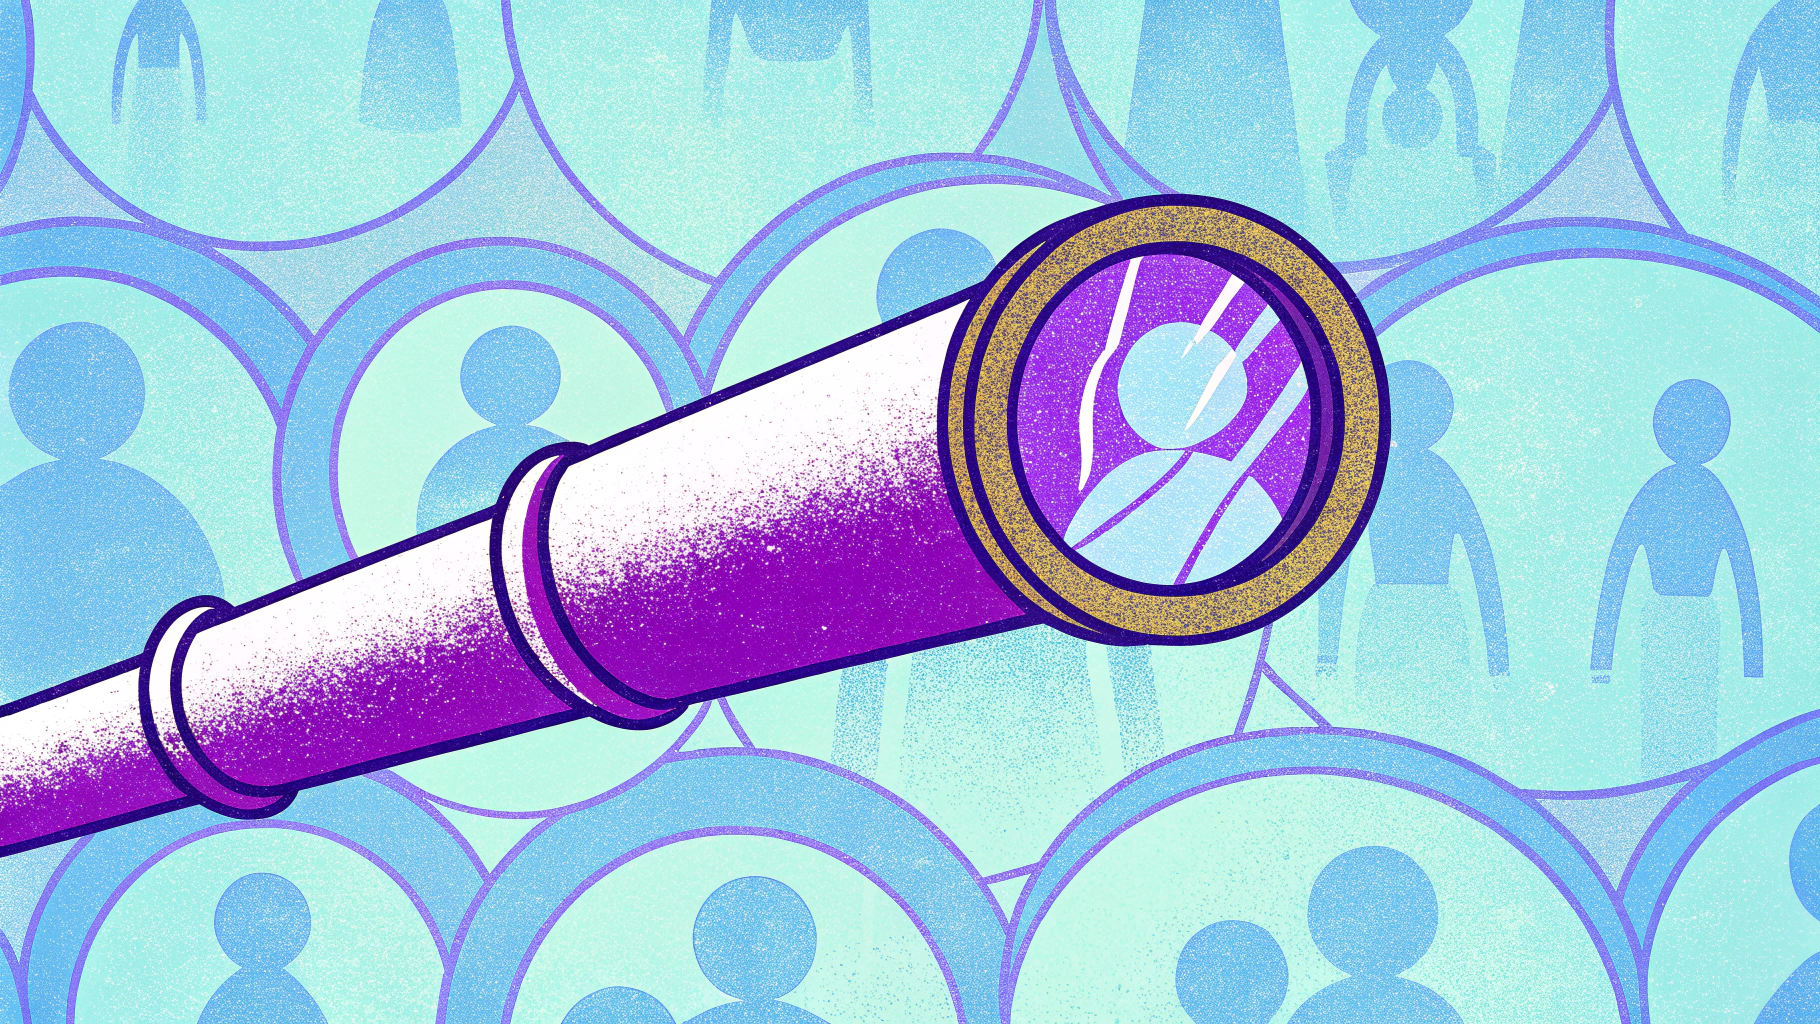
How do session replay and heatmap tools support behavioral analytics?
Replays add the missing context. Numbers tell you a drop-off exists; session replay tools show you the human moment it happened. Session replay combined with behavioral analytics avoids research bias by capturing real user interactions and complements heatmaps for richer insight into friction points.
Heatmaps reveal attention. Heatmap tools aggregate clicks, taps, and scroll depth into a single visual, exposing which parts of a page draw attention and which get ignored. Together, these tools offer a layered view: the heatmap shows the where, the replay shows the how.
A practical workflow. Use session replays to pinpoint issues visually, analyze patterns regularly, and combine quantitative metrics with qualitative replays for effective behavior analytics. That blend hard numbers plus watched sessions is the core methodology this entire discipline rests on.
Want to see your own friction points on a heatmap and in a replay side by side? Start with LiveSession.
What are behavioral analytics best practices for continuous monitoring?
Behavioral analytics best practices are less about one-time audits and more about a steady rhythm of observation. The teams that benefit most treat monitoring as continuous.
- Analyze patterns regularly. Schedule recurring reviews of replays and identify patterns across many users rather than reacting to one-offs.
- Never decide on a single session. Avoid making product decisions based on one replay; look for patterns that hold across a population.
- Pair the quantitative with the qualitative. Combine metrics with replays so every number has a story behind it.
- Watch your baselines. Track behavioral baselines over time so a new release's impact positive or negative is immediately visible against the anomaly it creates.
The discipline payoff. Continuous monitoring catches regressions early and confirms that improvements actually moved the needle. It is how behavioral analytics shifts a team from reactive firefighting to proactive optimization.
How does behavioral analytics turn user data into actionable product insights?
From observation to action. The endgame of all this captured user data is a decision. Behavioral analytics turns user behavior into a prioritized list of what to fix, build, or improve next.
The full loop in practice. Autocapture records every user interaction. Dashboards quantify the patterns. AI clusters sessions to reveal anomalies. Replays explain the friction. The team ships a fix and watches the baseline shift. That loop capture, analyze, act, verify is how raw data becomes product development decisions you can defend with evidence.
Why autocapture is the foundation. None of it works without complete data. By recording behavior automatically rather than waiting for engineers to instrument each event, autocapture ensures your behavioral insights are built on the whole picture, not a fragment. To go deeper on how that capture layer works, revisit the autocapture fundamentals.
Start turning user behavior into better products
You do not need more opinions about your product. You need to watch what your users really do, see where they struggle, and fix it with confidence. That is exactly what behavioral analytics with autocapture delivers and exactly what LiveSession was built to provide.
Autocapture every interaction, watch the replays behind your metrics, and surface the patterns that drive growth all in one platform. Sign up for LiveSession today and turn your user data into actionable insights starting with your very next session.
Related articles


Get Started for Free
Join thousands of product people, building products with a sleek combination of qualitative and quantitative data.