
Product Research for Product Teams: Methods, Tools, and Experiments

Product research is the disciplined process of proving whether a product idea will create measurable customer and business value before you commit significant resources to building it. The goal is not to gather opinions. It is to reduce the risk that you build something nobody needs, at a cost nobody can justify.
Start here, before you open a survey tool or schedule a single interview:
-
Define your success metric. Pick one primary metric the product must move (activation rate, week-2 retention, conversion from trial to paid). Write it down with a target number.
-
Write a testable hypothesis. “We believe [user type] will [do X] because [reason]. We’ll know we’re right when [metric] reaches [threshold].”
-
Run one small experiment this weekend. A five-person interview, a landing page with a waitlist, or a search-volume check in Ahrefs. You need signal, not certainty.
AWS prescriptive guidance recommends defining at least three measurable success metrics before research begins to avoid vanity metrics and build an auditable business case. That discipline is what separates product teams that learn fast from teams that run research theater.
Key Takeaways
Effective product research combines behavioral evidence with qualitative investigation, anchored to measurable business metrics defined before any study begins.
| Point | Details |
|---|---|
| Define metrics first | Set at least three success metrics tied to business outcomes before running any study. |
| Match method to question | Use qualitative methods for discovery and diagnosis; quantitative for validation and optimization. |
| Validate with experiments | Run a landing page test, concierge MVP, or prototype usability test before committing to a full build. |
| Make research continuous | Weekly replay reviews, monthly syntheses, and quarterly deep dives keep research connected to roadmap decisions. |
| Livesession for behavioral evidence | Livesession’s session replay, funnels, and heatmaps give product teams the behavioral signal that sharpens interview recruitment and hypothesis prioritization. |
Table of Contents
Why product research is a high-ROI activity
Many new products fail. That figure is cited so often it has lost its sting, but the mechanism behind it is specific: teams build solutions to problems they assumed existed, then discover the market disagrees. Research does not eliminate that risk. It prices it early, when a pivot costs days instead of quarters.
The business case for research is not philosophical. It shows up in concrete outcomes:
-
Lower customer acquisition cost. When you understand which problem segment is most acute, you stop spending on audiences who will never convert.
-
Higher retention. Products built on validated pain points have a natural stickiness that features added by committee rarely achieve.
-
Faster prioritization. A research backlog with evidence-ranked hypotheses cuts the roadmap argument from three hours to thirty minutes.
-
Reduced rework. Catching a usability failure in a five-person prototype test costs a fraction of fixing it post-launch.
ProductPlan’s product development strategy guidance frames this as a four-step discipline: start with why, define success metrics, build the business case, then prioritize features. Teams that skip step two — the metrics — end up optimizing for activity instead of outcomes. Tying research to OKRs or KPIs before the first interview is not bureaucracy. It is the thing that makes the research worth doing.
When should you run research?
The answer is: at every stage, but with different questions. Mapping research to lifecycle stage is what keeps you from running a six-week ethnographic study when what you actually need is a two-day smoke test.
Stage 1: Discovery and validation (before you build)
This is where the highest-leverage research lives. The questions here are existential: Does this problem exist at scale? Will people pay to solve it? Who is the real buyer?
-
Top questions: What job are users trying to do? What do they use today, and what frustrates them about it? What would make them switch?
-
Sample goals: Validate willingness to pay, confirm the problem is frequent and painful, identify the segment with the highest urgency.
-
Fastest high-confidence activities: Exploratory interviews (5–8 people), search-demand analysis, competitor teardowns, and a landing page with a CTA to measure intent.
Stage 2: Feedback and refinement (during build)
Once you have a prototype or early build, the question shifts from “should we build this?” to “are we building it right?”
-
Top questions: Can users complete the core task without help? Where do they get confused? Which features are actually used?
-
Sample goals: Achieve a task-completion rate above 80% in usability testing, reduce onboarding drop-off by 20%.
-
Fastest activities: Moderated usability tests, in-product surveys triggered at friction points, session replay review.
Stage 3: Monitoring and improvement (after launch)
Post-launch research is about catching drift before it becomes churn. The three-stage iterative approach from AWS prescriptive guidance treats continuous monitoring as the mechanism that enables data-driven pivots rather than gut-driven ones.
-
Top questions: Which features drive retention? Where are users abandoning? What do churned users have in common?
-
Sample goals: Reduce churn by 15%, increase feature adoption from 30% to 50%, cut support ticket volume on a specific flow.
-
Fastest activities: Funnel analysis, cohort retention reports, NPS follow-up interviews with churned users.
Core research methods and when to use each
Choosing a method is a matching problem. You match the question you need answered to the method that answers it most efficiently. Here is how the main methods break down.
Qualitative methods (the “why”)
-
User interviews: Best for discovery and understanding motivation. 5–8 participants give you enough pattern recognition for early-stage decisions. Time to insight: 1–2 weeks.
-
Usability testing: Best for validation and refinement. 5 participants catch roughly 85% of major usability issues. Time to insight: 3–5 days.
-
Session replay: Best for post-launch diagnosis. Watch real users struggle with a flow without scheduling a single session. Time to insight: hours.
Quantitative methods (the “what”)
-
Surveys: Best for measuring attitude, preference, or satisfaction at scale. Require 100+ responses for statistical confidence. Time to insight: 1–2 weeks.
-
Analytics and funnel analysis: Best for identifying where users drop off and which behaviors predict retention. Time to insight: real-time to 48 hours.
-
A/B testing: Best for optimizing a specific decision (copy, layout, flow) with statistical confidence. Requires sufficient traffic; typically 1–4 weeks per test.
Mixed methods (the “what + why”)
Pairing behavioral data with qualitative interviews is where the real insight lives. Drive Research’s analysis confirms that combined qualitative and quantitative methods produce more actionable findings than either approach alone.
How to plan a product research study
Good research planning takes about two hours. Bad planning wastes two weeks. The difference is specificity upfront.
Step 1: Define your objective and success metrics
Write one sentence: “We are running this study to learn [X] so we can decide [Y].” Then define at least three success metrics tied to business value. Generic examples:
-
Activation metric: % of new users who complete the core action within 7 days
-
Retention metric: % of users returning in week 4
-
Satisfaction metric: Task-completion rate or NPS score
Avoid metrics that measure research activity (number of interviews completed, survey responses collected). Measure what the research is supposed to change.
Step 2: Sampling and recruitment
Step 3: Timeline
A small study (5 interviews + synthesis) runs in 7–10 days. A medium study (survey + 8 usability sessions + analysis) takes 3–4 weeks. A programmatic research program with continuous analytics, monthly surveys, and quarterly deep dives is ongoing by design.
Deliverables checklist:
-
Research brief (objective, hypothesis, success metrics)
-
Screener and recruitment criteria
-
Discussion guide or survey instrument
-
Raw data repository (recordings, transcripts, responses)
-
Synthesis document (themes, evidence, prioritized hypotheses)
-
Decision log (what changed because of this study)
Pro Tip: Recruit participants who match your target user profile but have no prior exposure to your product or team. Recruiting from your existing power users introduces survivorship bias — they already like you, and their feedback will not reflect the experience of the users you are trying to acquire.
What tools belong in your research toolkit?
The right toolkit depends on your research stage, team size, and how much you need to integrate findings with your product workflow. Here is how the categories break down, with specific tools worth evaluating.
Market and SEO tools
Ahrefs is the clearest example of a lean research tool that most product teams underuse. Search query analysis reveals what problems people are actively trying to solve, at what volume, and with what language. That is demand validation before you write a single line of code. Pros: fast, cheap, real intent data. Cons: tells you what, not why.
Quantitative analytics
Google Analytics remains the default entry point for web-based product analytics. It gives you traffic sources, user flows, and goal completions without requiring engineering effort to instrument. Pros: free, widely supported, easy to share. Cons: session-level data is aggregated, so you cannot watch what individual users actually did.
Session replay and heatmaps
This is where behavioral evidence gets granular. Session replay tools let you watch individual user sessions, identify rage clicks, and see exactly where users abandon a flow. Livesession provides session replay, heatmaps, funnel analysis, error tracking, and event-based analytics in one platform, with integrations for Intercom, Zendesk, Shopify, and Segment.

Survey platforms
SurveyMonkey provides structured templates and recommended workflows for product research, including concept testing and sampling guidance. For teams that need effective survey design alongside behavioral data, pairing a survey platform with in-product analytics closes the gap between what users say and what they do.
Usability and testing platforms
Maze is purpose-built for unmoderated usability testing and concept validation. You can test a Figma prototype with real users, collect task-completion rates and time-on-task data, and get results in 24–48 hours. Pros: fast, quantified usability data, no scheduling required. Cons: unmoderated means you cannot probe unexpected behavior.
Tool selection checklist:
-
Does it integrate with your existing product stack (analytics, CRM, support)?
-
Does it meet your privacy and compliance requirements (GDPR, CCPA)?
-
Can your whole team access and act on the output, or does it create a data silo?
-
Does it support continuous research, or only one-off studies?
How to validate ideas with low-cost experiments
Validation is not about proving you are right. It is about finding out fast whether you are wrong. These experiments are ordered roughly by cost and commitment.
-
Search demand analysis. Use Ahrefs or Google Keyword Planner to check monthly search volume for the problem your product solves. If nobody is searching for it, the market may not know it needs a solution yet, or the problem is not acute enough to drive active search.
-
Landing page smoke test. Build a one-page description of the product and a CTA (waitlist signup, “notify me,” or a pre-order button). Drive traffic via paid ads or community posts. A signup rate above 5% is a meaningful signal of interest; below 2% warrants a pivot in positioning or problem framing.
-
Concierge MVP. Do the job manually for a small group of real users before building the automated version. If users will not pay for the manual service, they will not pay for the software either. Timeline: 1–2 weeks. Decision threshold: at least 3 of 5 users willing to pay or commit to continued use.
-
Prototype usability test. Build a clickable prototype in Figma or a similar tool and run 5 moderated sessions. Measure task-completion rate and time-on-task. If fewer than 3 of 5 users can complete the core task without help, the concept needs redesign before any engineering investment.
-
MVP with a build-measure-learn loop. Release the smallest version that delivers the core value, instrument it with analytics and session replay, and iterate based on real usage data. The Atlassian guidance on MVPs is explicit: real-world usage data guides development better than any pre-launch assumption.
-
Pre-orders or crowdfunding. For physical products or high-commitment software, a pre-order campaign tests willingness to pay with real money. A funded campaign is the strongest validation signal available.
When to escalate from experiment to full build:
-
At least two independent validation signals point in the same direction (e.g., high search demand + strong landing page conversion + users paying for the concierge version).
-
A defined percentage of your target segment expresses clear willingness to pay.
-
Usability tests show task-completion rates above 80% on the core flow.
How to embed research as a continuous capability
One-off studies are better than nothing. A continuous research program is what actually changes how a team makes decisions. The difference is cadence, roles, and artifacts.
Suggested cadences:
-
Weekly rapid checks (2–4 hours): Review session replays from the past week, check funnel metrics, flag anomalies. Owned by the PM or a rotating researcher.
-
Monthly synthesis (1–2 days): Aggregate findings from the month’s studies, update the research backlog, share a one-page summary with the broader team.
-
Quarterly deep dives (1–2 weeks): Run a structured study (interviews + survey + behavioral analysis) on a strategic question tied to the next roadmap cycle.
Role matrix:
| Activity | Owner | Collaborators |
|---|---|---|
| Recruitment | UX researcher or PM | Marketing (for panel access) |
| Study design | UX researcher | PM, designer |
| Data collection | UX researcher or PM | Engineer (instrumentation) |
| Analysis and synthesis | UX researcher | PM, designer |
| Prioritization | PM | Researcher, engineering lead |
Practical artifacts that make research repeatable:
-
Research backlog: A living list of open questions ranked by strategic importance and urgency. Treat it like a product backlog.
-
Synthesis templates: Standardized formats for interview memos, usability reports, and survey summaries so findings are comparable across studies.
-
Experiment registry: A log of every experiment run, its hypothesis, method, result, and the decision it informed.
-
Reporting cadence: A monthly one-pager shared with stakeholders that shows what was learned, what changed, and what is next.
The build-measure-learn loop only works if the “learn” step produces a documented artifact that feeds back into the next sprint or roadmap cycle. Without that artifact, research findings evaporate in Slack threads.
Common pitfalls and how to avoid them
Most research errors are not methodological. They are attitudinal. Teams run research to confirm decisions they have already made, then wonder why the product still fails.
The most common mistakes:
-
Relying only on claimed behavior. What users say they do and what they actually do are often different. Pairing survey claims with behavioral data from session replay or analytics is the most reliable way to catch this gap.
-
Survivorship bias in reviews and interviews. If you only talk to current users, you miss the people who tried the product and left. Churned-user interviews are uncomfortable and underused.
-
Bad survey question design. Leading questions, double-barreled questions, and Likert scales without anchors all produce noise. A question like “How much do you love our new feature?” is not research.
-
Small-sample overgeneralization. Five interviews are enough to identify themes for discovery. They are not enough to make a statistically significant claim about your entire user base.
-
Misreading correlation as causation. Users who use Feature X may have higher retention, but Feature X may not be causing the retention. Both could be driven by a third variable (company size, use case, onboarding quality).
Best-practices checklist:
-
Screen participants against your actual target profile, not just “people who use our product.”
-
Pre-register your analysis plan before collecting data. Decide what constitutes a positive result before you see the numbers.
-
Use at least two methods to validate any significant finding (mixed-methods validation).
-
Document negative results. A hypothesis that failed is as valuable as one that succeeded.
-
Separate data collection from analysis. The person running the interview should not be the only person interpreting the results.
Pro Tip: When qualitative signals conflict with behavioral analytics — users say they love a feature but session replays show they never use it — trust the behavioral data first. Then use a follow-up interview to understand why the gap exists. The conflict itself is the finding.
A practical workflow: behavioral analytics meets qualitative interviews
This is the workflow that consistently produces the most defensible product decisions. It pairs a behavioral signal with targeted qualitative investigation, so every hypothesis has two types of evidence behind it.
-
Define the metric you want to move. Example: reduce drop-off at step 3 of the onboarding funnel from 45% to 25%.
-
Instrument your analytics. Set up a funnel in your analytics platform (Google Analytics, Livesession, or equivalent) to track each step. Add event tracking for micro-interactions at the problem step.
-
Capture session replays for the drop-off segment. Filter replays to sessions where users reached step 3 but did not complete it. Watch 10–15 replays. Note the specific interaction patterns: where do they pause, click repeatedly, or abandon?
-
Run recruitment triggers. Use an in-product survey or behavioral trigger to recruit users who recently experienced the drop-off for a 20-minute interview. A message like “We noticed you didn’t finish setup — can we ask why?” converts well and reaches the right people.
-
Schedule targeted interviews. Run 5–8 interviews focused on the specific step. Use the replay observations as your discussion guide. Ask about the moment of confusion, not the product in general.
-
Synthesize findings into prioritized hypotheses. Produce three artifacts: a heatmap or replay clip showing the behavioral pattern, a one-page interview memo with direct quotes, and a ranked list of hypotheses with supporting evidence from both sources.
Session replays show users scrolling back and forth between two plan tiers repeatedly before leaving. Interviews reveal they cannot tell which plan covers their team size. The fix is a single line of copy clarifying the seat limit per tier. That change, informed by two hours of replay review and five interviews, lifts conversion by a measurable amount without a single engineering sprint.
Mastercard’s behavioral analysis guidance confirms that combining transaction-level behavioral data with qualitative segmentation produces the clearest link between user behavior and actionable product decisions.
Pro Tip: Keep a “conflict log” — a running document where you record every instance where behavioral data and qualitative data disagreed. Those conflicts are your highest-priority research questions for the next cycle.

What actually matters in product research (and what most teams get wrong)
Most teams treat product research as a phase. Run some interviews before the kickoff, do a usability test before launch, ship. That framing is the problem.
The teams that consistently build products people use treat research as an operating rhythm, not a project milestone. The question is never “did we do research?” It is “what did we learn this week, and what are we doing differently because of it?”
There is a subtler mistake underneath that one. Teams fall in love with their methods. They run interviews because interviews feel rigorous. They run surveys because surveys produce charts. Neither is wrong, but both become useless when the method is chosen before the question. The question comes first, always. If you need to know whether users can complete a task, run a usability test. If you need to know why retention dropped last month, watch session replays before you schedule a single interview.
The other thing worth saying plainly: analytics tied to business outcomes consistently outperform research programs that measure research activity. Counting interviews completed is not a success metric. Moving retention by 10% is.
Start with one hypothesis. Pick the method that tests it fastest. Document what you learned. Repeat.
Livesession fits naturally into this kind of research workflow
Product teams running the mixed-methods workflow described above need one thing from their tooling: speed from signal to evidence. Livesession delivers that by combining session replay, heatmaps, funnel analysis, error tracking, and event-based analytics in a single platform built for product teams.
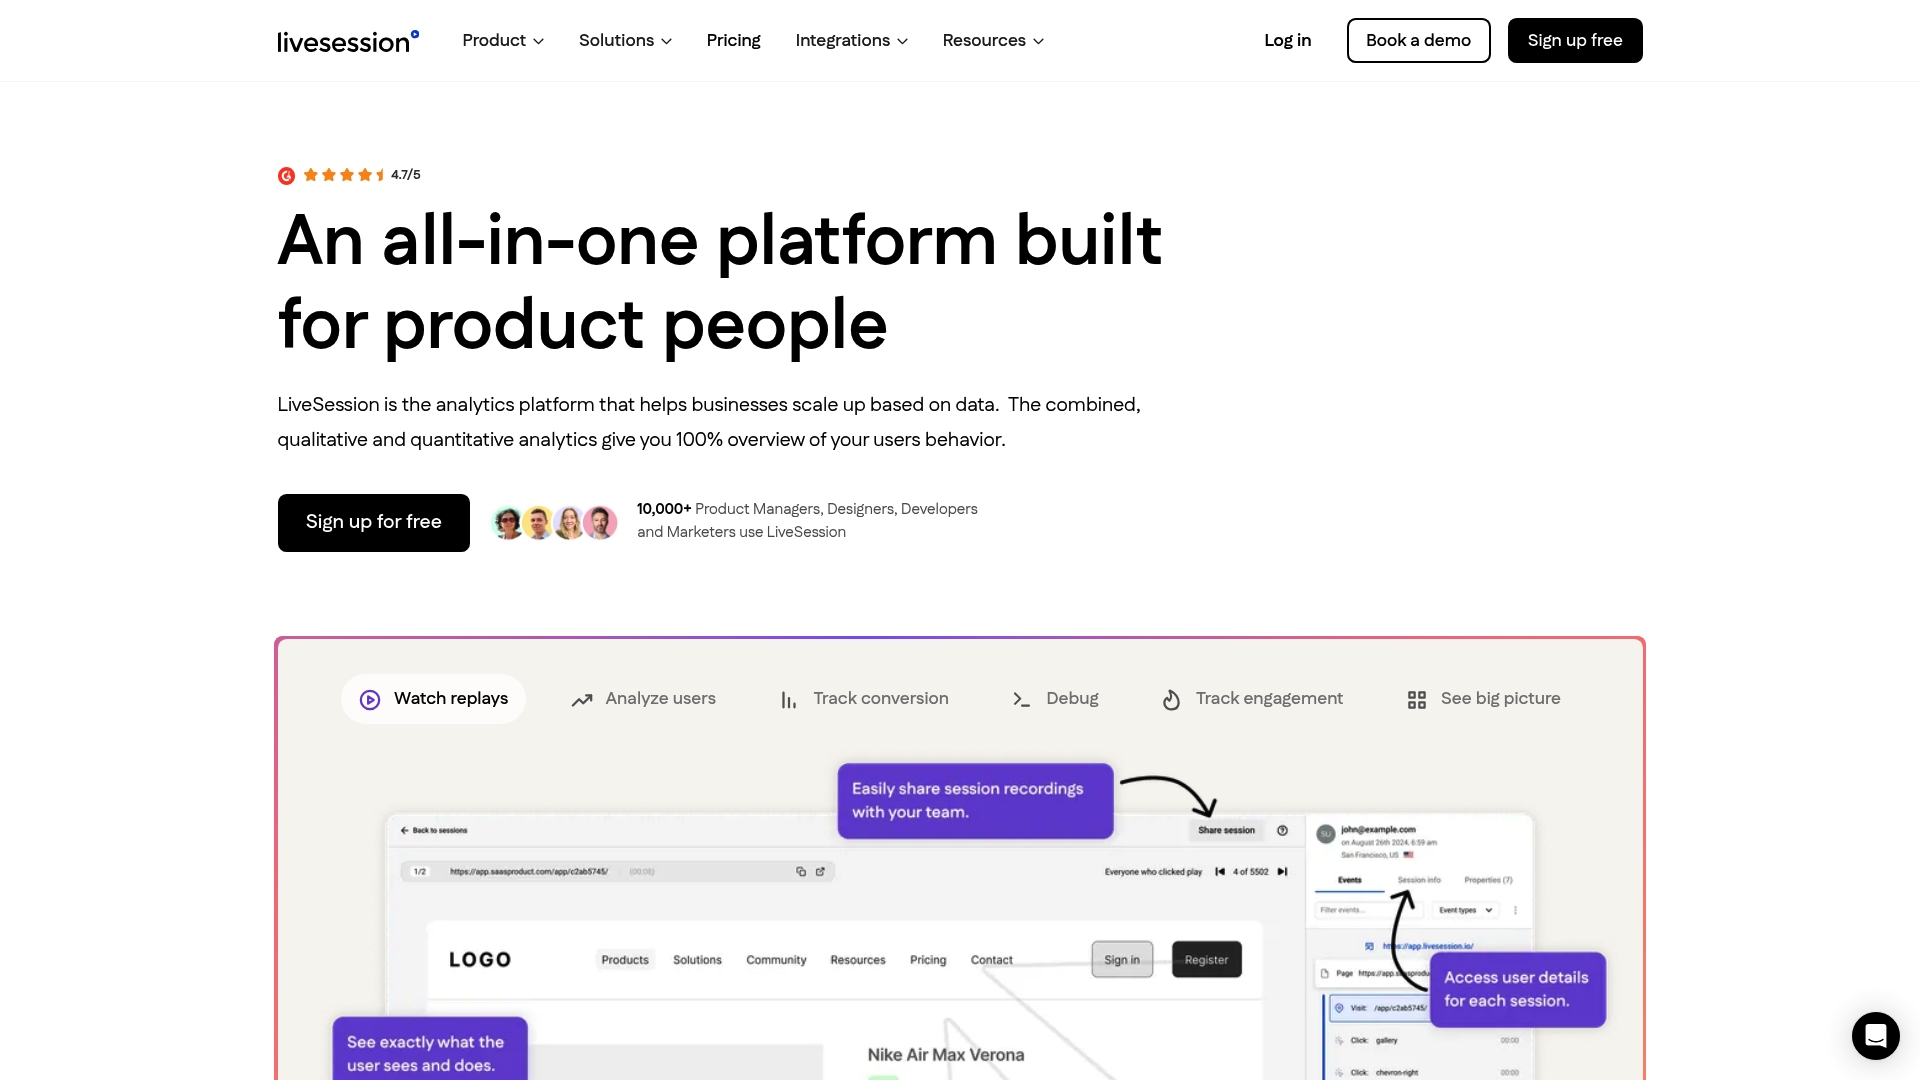
Where most analytics tools show you aggregate drop-off rates, Livesession lets you filter to the exact sessions behind that number and watch them. That speed matters because it compresses the time between a behavioral signal and a targeted interview recruitment trigger. Designers use heatmaps to prioritize layout changes before usability testing. Engineers use error tracking to triage bugs that session replays surface. Researchers use funnel data to write sharper interview discussion guides.
Livesession integrates with Intercom, Zendesk, Shopify, and Segment, so findings connect directly to your support queue, CRM, and data warehouse without manual exports. GDPR and CCPA compliance is built in. Livesession to see how it fits your team’s research workflow.
Sources
The sources below directly informed this article. Each is worth bookmarking for your own research practice.
Related articles



Get Started for Free
Join thousands of product people, building products with a sleek combination of qualitative and quantitative data.