
User Track: A Practical System for Product Teams

User track means linking every event a person triggers, clicks, errors, upgrades, to a stable identifier so you can reconstruct their whole journey instead of staring at disconnected averages. The recommended approach: plan an event taxonomy before you write a single line of tracking code, use hybrid instrumentation (client-side for UI interactions, server-side for anything that touches money or auth, webhooks for account changes), mask personally identifiable information at the point of capture, and pair your event data with privacy-aware session replay so you can see the “why” behind the numbers.
Done right, this setup pays off fast in three ways:
-
Faster debugging, because you can filter to the exact session where an error fired instead of guessing.
-
Real segmentation for product decisions, separating power users from those about to churn.
-
Early churn prediction, since drop-off patterns show up in the data weeks before a cancellation.
Pro Tip: Don’t try to track everything on day one. Pick the one business question that matters most this quarter (usually activation or upgrade friction) and build your first event set to answer just that.
Key Takeaways
Reliable user tracking depends on a stable non-PII identity, a deliberately small event taxonomy, and privacy-safe session replay paired with quantitative analysis, not any single tool.
| Point | Details |
|---|---|
| Start with the question | Instrument only the events that answer your top three product questions this quarter. |
| Use a stable, non-PII identity | Anchor every event to an internal ID, never a raw email, to enable cross-device analysis. |
| Combine sync methods | Pair batch APIs with audit webhooks and periodic re-syncs to avoid missed user updates. |
| Pair events with replay | Use error and funnel events to find sessions, then use replay to understand why they failed. |
| Livesession for the qualitative layer | Livesession pairs session replay and error tracking with your event data to speed up debugging and UX fixes. |
Table of Contents
What Is User Tracking, and What Is It For?
User tracking is the practice of stitching individual events, page views, clicks, purchases, errors, into a persistent history tied to one identity, so you can analyze a person’s path rather than a page’s traffic. It’s the difference between knowing “10,000 people viewed the pricing page” and knowing that the specific users who viewed pricing three times before churning all hit the same broken toggle.
Teams pursue user tracking for a handful of overlapping goals:
-
Analytics: understanding feature adoption, conversion rates, and engagement trends over time.
-
Troubleshooting: reproducing bugs by seeing exactly what a specific user did before an error.
-
Personalization: tailoring onboarding or messaging based on past behavior.
-
Cost allocation: in usage-based products, tying resource consumption to specific accounts.
-
Compliance auditing: proving who accessed or modified what, and when.
Aggregate analytics tells you what happened across a population. User-level behavior tracking tells you who it happened to, which is what lets you segment by churn risk or lifetime consumption instead of just watching a line go up or down on a dashboard.
A user record built from event count, session duration, and resource usage doesn’t just describe activity. It’s the raw material for spotting your power users and your at-risk users in the same query.
Key User Behaviors and Events to Capture
Not every click deserves a tracking call. Start with the events that map directly to a product decision, then expand.
Core interaction events: page views, clicks on key CTAs, form starts and submissions, search queries, errors (with error codes), and feature-flag exposure.
Lifecycle and SaaS-specific events: signup, onboarding step completion, first value moment, plan upgrade or downgrade, cancellation, and support ticket creation. These map almost one-to-one to revenue and retention.
Every event needs consistent properties attached, or your analysis breaks down later:
-
A stable
user_idthat survives login/logout and device switches. -
A
session_idfor grouping activity within a visit. -
A precise
timestamp. -
deviceandplatformcontext. -
error_codewhere relevant. -
feature_flagstate, so you can tie behavior to experiment variants.
A sample event might look like checkout_completed with properties user_id, plan_tier, payment_method, discount_applied, and timestamp. Naming consistency (object_verb_past_tense, like invoice_downloaded) sounds pedantic until you’re six months in and half your events use _clicked and the other half use _click.
| Point | Details |
|---|---|
| Track lifecycle events | Signup, activation, upgrade, and cancellation map directly to retention analysis. |
| Attach stable properties | Every event needs user_id, session_id, timestamp, and device context to be queryable later. |
| Name events consistently | Pick one naming convention and enforce it, or cross-team analysis becomes guesswork. |
How to Instrument User Tracking: Plan, Build, Validate
Good instrumentation follows a sequence. Skipping the planning step is the single most common reason teams end up with unusable data six months later.
-
Define the business questions first. Write down the three things you actually need to know (activation rate, feature adoption, upgrade drivers) before naming a single event.
-
Design the event taxonomy. Map each event to one of those questions. If an event doesn’t answer a question, don’t build it yet.
-
Pick an identity strategy. Use an internal, non-PII stable ID, never a raw email, as the anchor for cross-session and cross-device tracking.
-
Instrument. Client-side SDKs (like a JavaScript snippet) capture UI interactions fast; server-side calls are more reliable for anything tied to billing, auth, or data you can’t trust the browser to report accurately.
-
Validate before shipping. Run a QA pass checking for duplicate fires, missing properties, and timestamp drift.
A basic client-side call for a button click, attaching the user identity, looks like this:
analytics.track("upgrade_clicked", {
  user_id: currentUser.id,
  plan_tier: currentUser.plan,
  timestamp: Date.now()
});
For anything that changes user state, plan updates, deletions, role changes, don’t rely purely on client events. A hybrid pattern works better: use a batch sync API for periodic reconciliation and webhooks for near-real-time updates, with scheduled re-syncs as a fallback when webhooks get throttled or dropped.
Your QA checklist should specifically test for: duplicate event fires on page reload, missing user_id on logged-out-then-logged-in flows, and events firing before a page fully loads (timing issues that create phantom sessions).
Pro Tip: Build one dashboard that just counts raw event volume per day, per event name. It’s the fastest way to catch a broken tracker before it corrupts a month of reports.

Which Tools Fit Which Tracking Job?
No single tool does everything well, and trying to force one to is how teams end up with bloated, slow-loading pages and analysts who don’t trust the data.
-
System-level analytics (Google Analytics / GA4): best for traffic sources, marketing funnels, and high-level conversion tracking across a whole site. A deeper look at GA4’s event model is worth reading before you configure custom events.
-
Product analytics platforms (Mixpanel, Amplitude): built for feature adoption, retention curves, and cohort analysis inside an app, where GA4’s page-centric model starts to strain.
-
Session replay and heatmaps (Hotjar, Contentsquare): show you exactly where a cursor hesitated or a tap missed a button, the qualitative layer that raw event counts can’t provide.
-
Error and observability tools: capture stack traces and error codes tied to a specific session, critical for engineering debugging.
-
Data warehouse + BI: for teams that need to join tracking data with billing, support, or CRM records for custom reporting.
The practical pairing that most product teams underuse: event analytics answer “what happened and where,” while session replay answers “why.” A tool like Livesession combines both in one workflow, letting you jump from a spike in an error event straight into the replay of the session that triggered it.
Pro Tip: Resist the urge to buy five tools in month one. Instrument to answer your top three product questions, then add tooling only when a real gap shows up.
How to Turn Tracked Events Into Product Decisions
Raw event data is inert until you run it through the right analysis method for the question you’re asking.
Quantitative methods get you the “how many” answers:
-
Funnels, to see where users drop between signup and activation.
-
Cohort retention curves, comparing user groups by signup week or acquisition channel.
-
Segmentation, splitting behavior by plan tier, device, or geography.
-
A/B test telemetry, tying variant exposure to downstream conversion.
-
Cost-per-user calculations, especially in usage-based pricing models.
Qualitative methods get you the “why”:
-
Session replays for flows with unexpectedly high drop-off.
-
Rage-click detection, flagging repeated clicks on an unresponsive element.
-
Form analytics showing which fields cause abandonment.
A few concrete queries worth running monthly: conversion rate by onboarding step, error rate segmented by user cohort, and time-to-first-value for new signups. Daily active user dashboards grouped by week catch adoption slumps faster than a monthly report ever will.
-
Cohort analysis shows week-two retention dropped 15 points after a UI change.
-
Session replay of that cohort reveals users can’t find the new settings menu.
-
Team ships a tooltip; next cohort’s retention recovers.
That loop, quantitative signal, qualitative confirmation, targeted fix, is the actual engine behind most meaningful product improvements, not a single metric on a dashboard.
Privacy, Consent, and Safety Best Practices
Skipping privacy controls doesn’t just create legal exposure, it corrupts your data when regulators or users force you to retroactively delete records you never isolated properly.
Consent matters before anything else. Depending on your jurisdiction and audience, you’ll need an opt-in banner before firing certain tracking scripts, or you’ll need to document a legitimate-interest basis and let users object.
-
Never store raw PII (email, name, phone) directly in analytics event properties. Use a hashed or internal ID instead.
-
Mask sensitive fields (payment info, passwords, personal messages) in session replay tools before recording starts, not after.
-
Set explicit retention windows and delete personal data automatically once that window closes.
-
Encrypt data at rest and in transit, and restrict who on your team can query raw session data.
Statistic Callout: Even server-side approaches aren’t new: Apache’s mod_usertrack module has offered a CookieTracking directive for decades, letting administrators toggle tracking cookies on or off per directory or host, a reminder that consent controls belong at the infrastructure level, not just the frontend banner.
Pro Tip: Run a quarterly audit of every event schema in production. If a field hasn’t been queried in six months, it’s either dead weight or a privacy liability. Cut it.
Common Mistakes and Fast Fixes
The same failure patterns show up across almost every team that skips planning.
-
Tracking everything. Every click becomes an event, and the resulting noise makes real signals impossible to find.
-
Inconsistent naming.
signUpComplete,signup_finished, andSignUp_Doneall existing in the same schema is a red flag. -
Skipping QA. Shipping tracking code without testing means finding out three months later that half your events never fired.
-
Over-relying on vanity metrics. Page views and session counts feel good on a slide but rarely reveal actual product friction the way journey and drop-off analysis does.
Best practice fix: publish a living event taxonomy document, audit it quarterly, and keep a minimal core set of events instrumented server-side where accuracy matters most.
Pro Tip: If an event stream suddenly gets noisy, the fastest remediation is to check for a recent deploy that duplicated a tracking call, not to assume your users just got more active.
Implementation Checklist, Timeline, and Cost Considerations
A realistic rollout follows a predictable sequence, and most teams underestimate the validation step more than any other.
-
Define the KPIs you’re actually trying to move.
-
Design your event taxonomy against those KPIs.
-
Instrument the initial event set, client and server side.
-
QA for duplicates, missing properties, and timing bugs.
-
Deploy to production behind a feature flag if possible.
-
Monitor volume and quality, then iterate quarterly.
Rough timeline: setting up a minimum viable tracking covering your top three questions takes a few weeks. A fuller rollout across product, onboarding, engagement, and billing events typically takes several months. After that, plan on quarterly governance reviews rather than treating instrumentation as a one-time project.
Cost drivers worth budgeting for:
-
Event volume and the pricing tier it pushes you into.
-
Session replay storage, which scales with retention window length.
-
Data warehouse costs if you’re piping events for custom BI.
-
Engineering time for instrumentation and ongoing QA.
For state changes tied to user accounts, combining an initial sync with audit webhooks, plus a periodic fallback re-sync, avoids the gaps that pure webhook-only approaches create when delivery gets throttled.
Why Pair Session Replay With Event Analytics
It doesn’t tell you why. That’s the gap session replay closes, showing the actual mouse movement, hesitation, and misclick that a metric alone can’t surface.
The practical workflow:
-
Flag: an analytics alert catches the error spike.
-
Inspect: pull up the specific sessions tied to that error event in replay.
-
Fix: engineering sees the exact interaction pattern and ships a targeted fix.
-
Verify: replay and telemetry together confirm the error rate drops after deploy.
Livesession builds this loop directly, combining session replay, error tracking, and event-based analytics with masking for sensitive fields and integrations for tools like Intercom and Zendesk.
An error event narrows a haystack of thousands of sessions down to the twelve that actually matter. Replay is what turns that narrowed list into an answer.
| Point | Details |
|---|---|
| Events narrow, replay explains | Use error and funnel events to find the sessions worth watching, then replay to see the cause. |
| Masking protects sensitive data | Session replay tools should mask payment fields and personal input automatically, not on request. |
What Actually Moves the Needle in User Tracking
Most advice on this topic treats instrumentation as a checkbox: install a script, name some events, ship it. That’s backwards. The teams that get real value start with the business question, not the tool, and they resist the instinct to track every click “just in case.” That instinct is exactly what produces the bloated, unqueryable event streams most analytics teams inherit and then spend a quarter cleaning up.
The overrated piece of conventional wisdom is that more data automatically means better decisions. It doesn’t. A schema with 40 well-named, properly-scoped events beats one with 400 poorly-documented ones every time, because someone can actually reason about 40.
What’s underrated: pairing quantitative and qualitative data isn’t a nice-to-have layered on top of “real” analytics, it’s often the fastest debugging path available. A cohort chart tells you retention dropped. A replay tells you why in thirty seconds. Prioritize identity strategy and taxonomy design before you shop for tools. The tool matters less than most vendors want you to believe.

See User Tracking and Replay Work Together With Livesession
Livesession gives product teams the piece most event-only analytics tools skip: the ability to actually watch what happened, not just infer it from a chart. Where GA4 or Mixpanel tell you a funnel step dropped, Livesession lets you replay the exact sessions behind that drop, with sensitive fields automatically masked and integrations into tools like Intercom, Zendesk, Shopify, and Segment already built in.
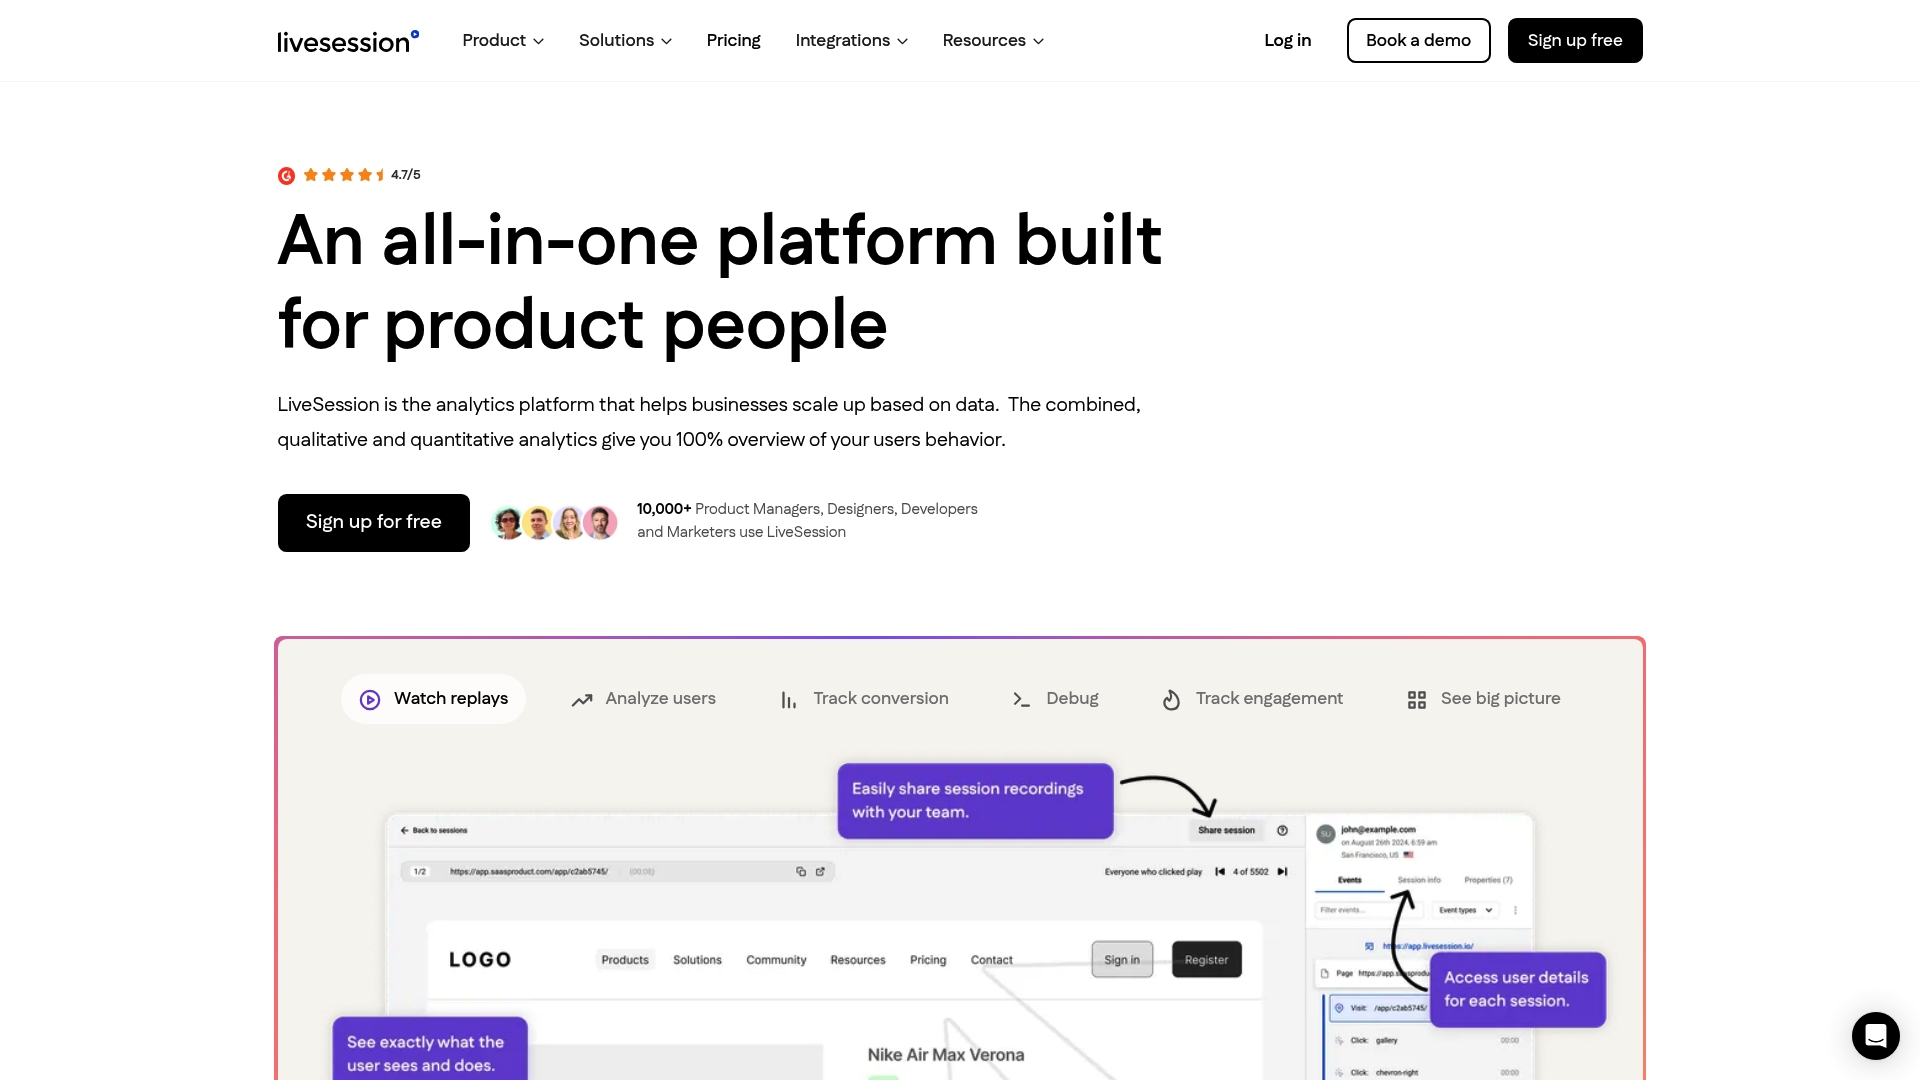
That combination matters most right after you’ve built your event taxonomy: once you know which sessions matter, you need a fast way to inspect them without exporting logs or asking an engineer to reproduce a bug manually. Livesession’s session replay, heatmaps, and error tracking sit on top of your existing event data instead of replacing it, so the instrumentation work covered above feeds directly into a workflow your whole product team can use, not just whoever writes the SQL query.
If you’re instrumenting a new event taxonomy or trying to debug a friction point you can already see in your funnel data, start a Livesession trial and connect it to your current tracking setup this week.
Frequently Asked Questions
What is the difference between user tracking and web analytics? Web analytics usually reports aggregate metrics like total sessions or page views. User tracking ties individual events to a persistent identity, so you can analyze one person’s full journey across sessions and devices.
How do you track users without violating privacy regulations? Use a consent-first approach, rely on hashed or internal IDs instead of raw PII, mask sensitive fields in session replay, and set retention windows that automatically delete personal data after a defined period.
Which tool should a small product team start with? Start with one product analytics tool for event data and one session replay tool for qualitative context. Adding GA4, Mixpanel, Amplitude, and a heatmap tool simultaneously usually creates more noise than insight.
How many events should a typical tracking plan include? There’s no universal number, but most teams do better starting with 15 to 30 well-named core events tied to specific business questions, then expanding only when a real gap appears.
Can you track users across devices without cookies? Yes, by assigning a stable internal user ID at login and attaching it to every event regardless of device, you avoid relying entirely on cookies, which get blocked or cleared inconsistently across browsers.
Sources
Related articles


Get Started for Free
Join thousands of product people, building products with a sleek combination of qualitative and quantitative data.