
p75 Application Performance Metrics for Product Teams


For product teams using session replay and product analytics, the metrics worth tracking are Core Web Vitals (LCP, INP, CLS) plus session-replay signals like rage clicks and JS errors, measured in the field at the 75th percentile. Together, they show which UX regressions are actually costing conversions, not just which pages load slowly in a lab test.
Key metrics explained: what each measures and when to prioritize it
Largest Contentful Paint (LCP) measures how long the biggest visible element on a page takes to render. A common target is 2.5 seconds or less, because that’s roughly the point where users stop perceiving a page as slow. LCP failures often point to unoptimized images, slow server responses, or render-blocking scripts.
Interaction to Next Paint (INP) replaced First Input Delay as the responsiveness metric because it tracks the slowest interaction across an entire visit rather than just the first one. The good threshold is 200 milliseconds or less, and a bad INP score usually means heavy JavaScript execution is blocking the main thread when someone clicks, taps, or types.
Cumulative Layout Shift (CLS) captures visual stability: how many content jumps around as a page loads. The target is 0.1 or lower, and high CLS often comes from images without dimensions or ads that inject content late.
A handful of supporting lab metrics help you root-cause these field scores:
-
Time to First Byte (TTFB) flags slow server or network responses before rendering even starts.
-
First Contentful Paint (FCP) shows when the first pixel appears, useful for isolating early-load bottlenecks.
-
Total Blocking Time (TBT) estimates main-thread blocking during load, a lab proxy that correlates with INP problems.
-
Time to Interactive (TTI) marks when a page becomes reliably responsive to input.
None of these technical scores explain why a shopper abandons checkout. That’s where session-replay signals earn their place: rage clicks (repeated frantic clicking on an unresponsive element), repeated form attempts, aborted checkouts, and spikes in JavaScript error frequency. A page can pass every Core Web Vitals threshold and still bleed conversions because a dropdown menu confuses users or a form field silently rejects valid input. The Baymard Institute has found that fixing checkout usability issues can strongly increase conversions, which is a reminder that design friction, not just load speed, drives abandonment.
How to measure: field data, lab data, and the p75 rule
Lab testing (Lighthouse, Chrome DevTools) runs in a controlled environment and is good for catching regressions before deployment. It cannot capture what real users experience on a mid-range phone over a spotty connection, which is why field measurement, also called real-user monitoring (RUM), matters for anything you report externally or used to prioritize fixes.
A practical setup:
-
Instrument your site with web-vitals.js or a RUM provider to capture LCP, INP, and CLS from actual visitors.
-
Aggregate scores at the 75th percentile, not the average, per device category.
-
Tag each interaction event with context (element clicked, page state) so a metric failure can be traced back to a specific session replay.
-
Use TBT and Lighthouse runs as a pre-release lab proxy before the field data catches problems in production.
Statistic Callout: Google recommends measuring Core Web Vitals at a high percentile, around the 75th, to represent typical user experiences of page loads, segmented across mobile and desktop, as the standard for a “good” experience. That threshold filters out one-off outliers while still reflecting what most users actually encounter.
One implementation detail trips up a lot of teams: the Event Timing API does not report interactions faster than 104 milliseconds by default, and iframes may not pass timing events up to the parent frame. If your product embeds widgets or third-party checkouts in iframes, your INP data can look better than reality unless you account for that gap.
Diagnose problems with session replay: patterns and triage steps
Metrics tell you something is wrong. Session replay tells you what and why. A typical triage starts the moment a page or flow shows a p75 failure in your RUM dashboard.
-
Pull a sample of recent sessions that contributed to the failing p75 score.
-
Scan for rage clicks, repeated form submissions, and abrupt exits mid-flow.
-
Cross-reference JS error timestamps and network failures against the moment the user seemed to struggle.
-
Tag the sessions and write repro steps engineers can follow without re-watching everything.
A common pattern looks like this: LCP and INP both pass comfortably, yet checkout abandonment stays high. Replays often reveal the real cause, a confusing shipping-option layout or a validation error that never surfaces visibly, which lines up with Baymard’s research showing design flaws, not raw speed, drive most checkout drop-off.
The workflow scales across a product: segment sessions by page and traffic cohort, filter to ones tied to a metric failure, replay and tag the friction point, then hand engineering a ticket with evidence attached rather than a vague bug report. LiveSession’s session replay tools are built around exactly this loop, pairing recordings with error tracking and funnel data so a product manager can confirm a hypothesis before ever opening a ticket. Guides on analyzing session recordings walk through sampling strategy in more detail, and A privacy first architecture can keep that diagnostic work compliant by design.

Pro Tip: Start every triage with the session replay filtered to the exact page and device segment that failed, not a general sample: it cuts review time dramatically.
Prioritize fixes and validate the impact
Not every regression deserves the same urgency. Weigh fixes by conversion impact against engineering effort, and start with high-traffic pages showing both a metric failure and a clear qualitative signal like rage clicks.
-
Rank candidate fixes by estimated conversion impact divided by effort to implement.
-
Ship the fix, then validate with an A/B test or a before/after comparison on the same page.
-
Watch p75 metrics and a fresh sample of session replays after release to confirm the friction is actually gone.
-
Set alerts for metric regressions so a new deploy doesn’t quietly reintroduce the same problem.
This loop, measure, fix, validate, monitor, turns raw performance data into decisions a roadmap can actually use instead of a dashboard nobody revisits.
Privacy and consent snapshot for behavioral monitoring
Session replay and analytics tools collect behavioral data, which means consent has to be freely given, specific, informed, and unambiguous under UK data protection law: pre-ticked boxes or implied consent do not qualify. In practice, that means masking personally identifiable information in replays, offering a clear opt-out, setting sensible retention limits, and checking jurisdiction-specific rules with legal counsel. LiveSession’s approach to session replay builds these controls in rather than treating them as an afterthought.

Treating performance metrics as product signals
Product managers, not just engineers, should own user-facing metrics: a passing Core Web Vitals score means nothing if a session replay shows users still abandoning the flow. Bake replay review into every sprint that touches a conversion path.
Try LiveSession to connect metrics with real sessions
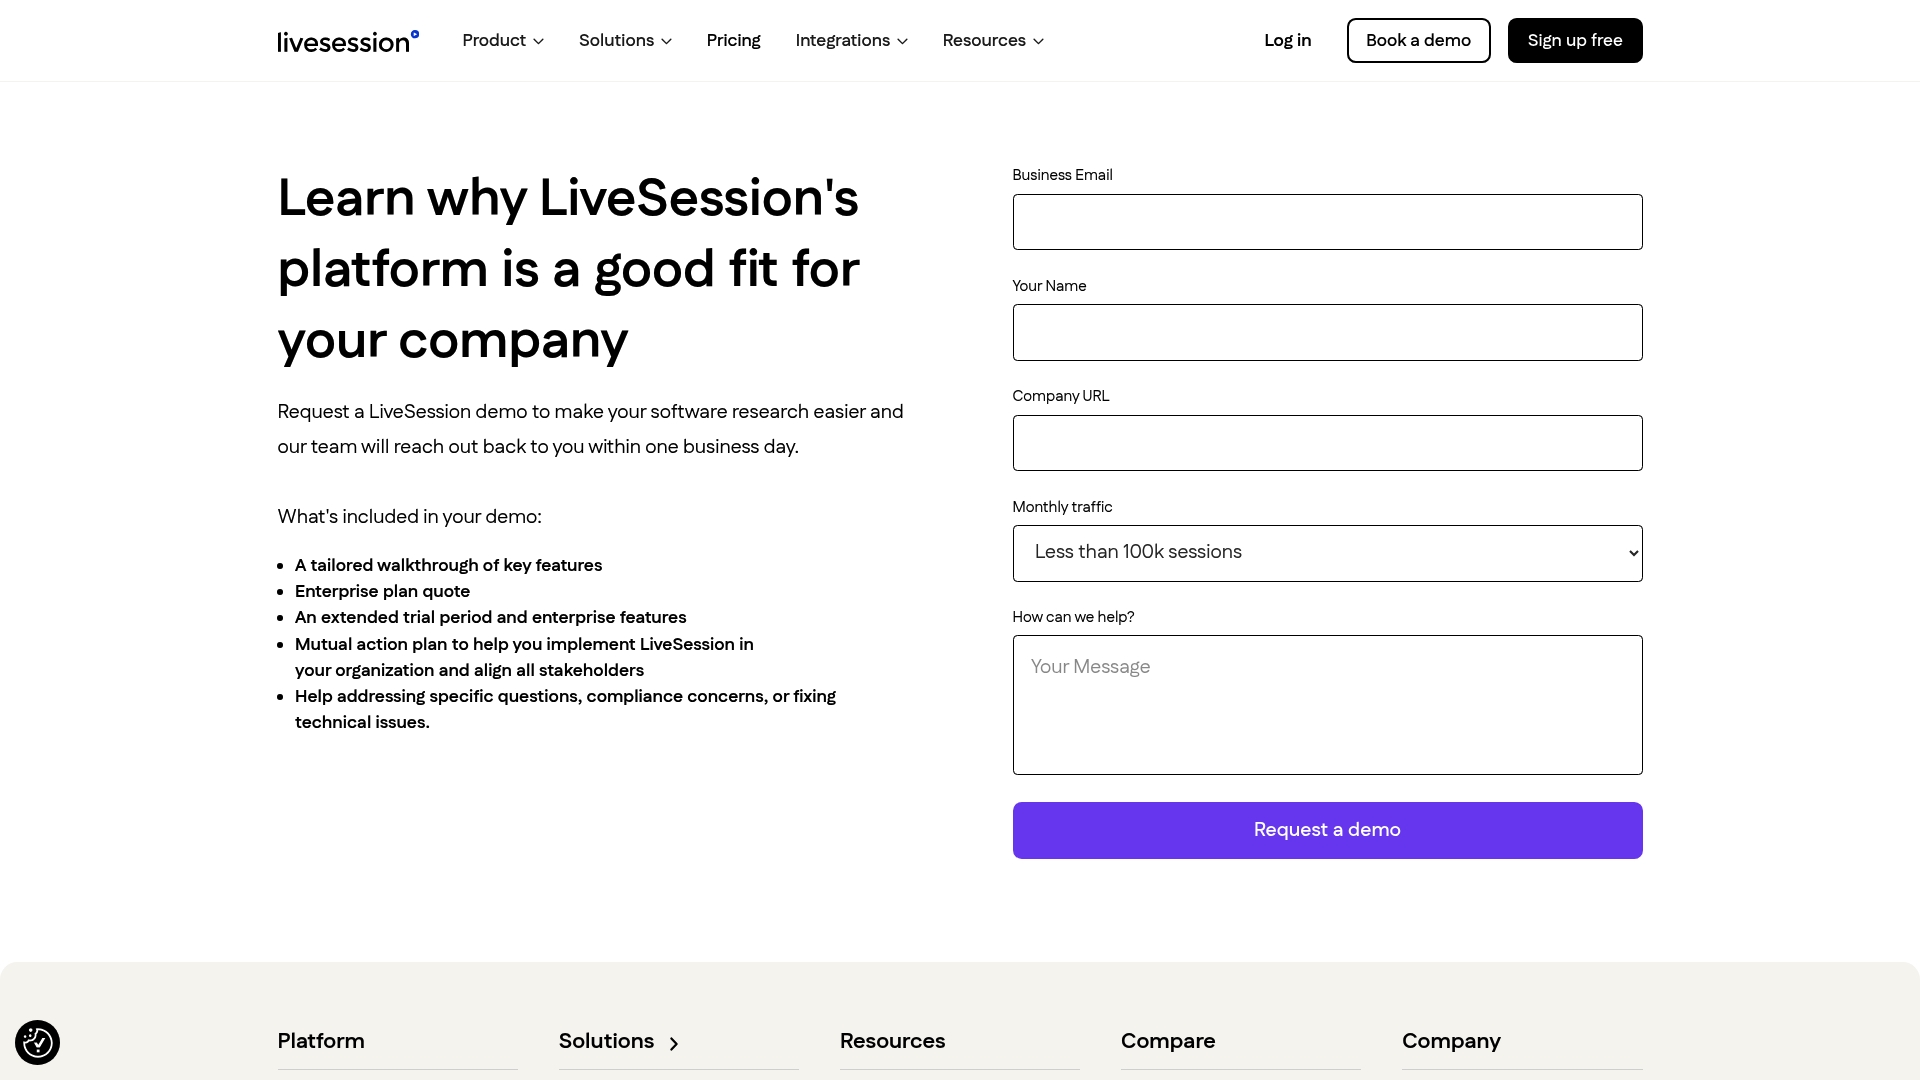
Some analytics platforms pair session replay, heatmaps, funnels, and error tracking with privacy controls built for GDPR and CCPA compliance, helping users see the “why” behind every metric failure without building instrumentation from scratch.
-
Explore plans on the LiveSession pricing page, including a Free tier.
-
Check the heatmap and clickmap tools to see behavior patterns alongside performance data.
Sources
Google’s Core Web Vitals docs, web.dev’s INP guide, Baymard’s checkout research, and a broader guide on measuring website success round out the technical and business context here.
FAQ
What are the most important application performance metrics to track?
The core ones are Largest Contentful Paint, Interaction to Next Paint, and Cumulative Layout Shift, known together as Core Web Vitals. Pair them with session-replay signals like rage clicks and JavaScript errors to see the UX impact behind the numbers.
Why did INP replace FID as a Core Web Vital?
FID only measured the delay before the very first interaction, missing everything that happened afterward. INP tracks the slowest interaction across an entire page visit, giving a more complete picture of responsiveness.
Why measure performance at the 75th percentile instead of the average?
An average can be skewed by a few very fast or very slow sessions, hiding what most people actually experience. Google recommends the 75th percentile because it reflects a “good” experience for the majority of visits while filtering out outliers.
How does session replay help diagnose performance problems?
Metrics show that something failed; replays show what a user actually did, such as clicking a broken button repeatedly or abandoning a confusing form. Tools like LiveSession let teams confirm the root cause before writing an engineering ticket.
Do session replay tools require user consent?
Yes. Behavioral monitoring tools need consent that is freely given, specific, informed, and unambiguous, and pre-checked boxes or silence do not count as valid consent.
Related articles



Get Started for Free
Join thousands of product people, building products with a sleek combination of qualitative and quantitative data.