
Conversion Funnel Analysis: How to Find Where Users Drop Off

.png)
Your signup flow converts at eleven percent. You know that number, and it tells you nothing you can act on. Somewhere between the landing page and the confirmation screen, most of your visitors quietly leave, and the aggregate rate hides every reason why.
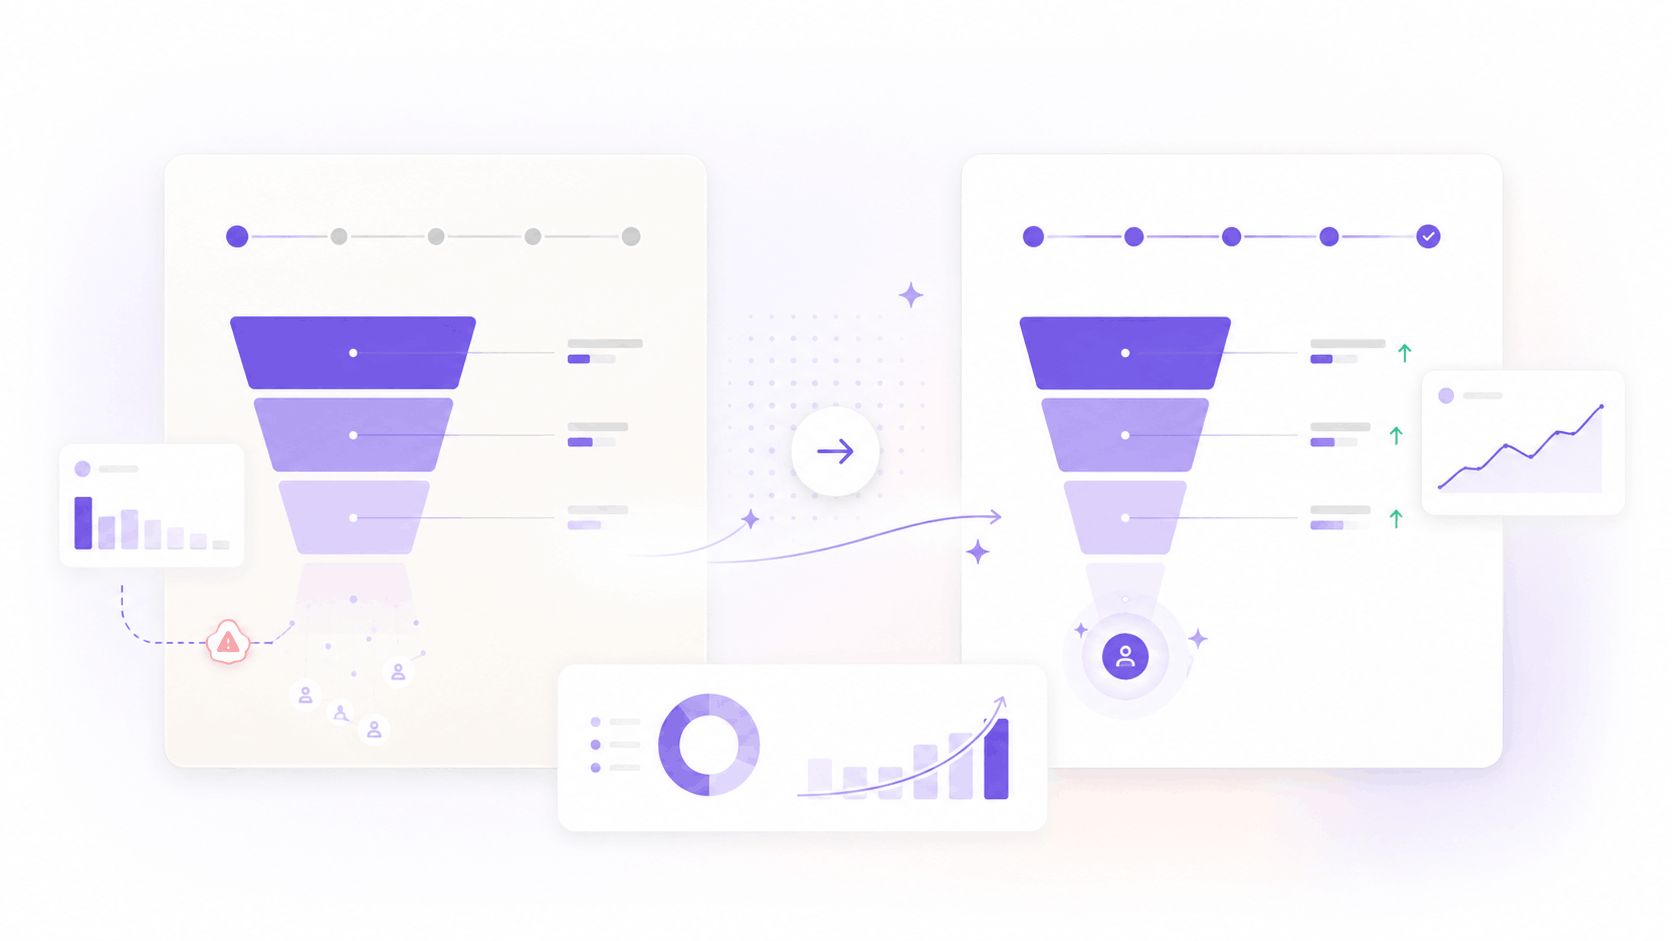
Conversion funnel analysis breaks that number into steps so the drop-off has an address. This guide covers how to build a funnel, how to read the data, and how to find the specific step that is costing you the most.
What is conversion funnel analysis?
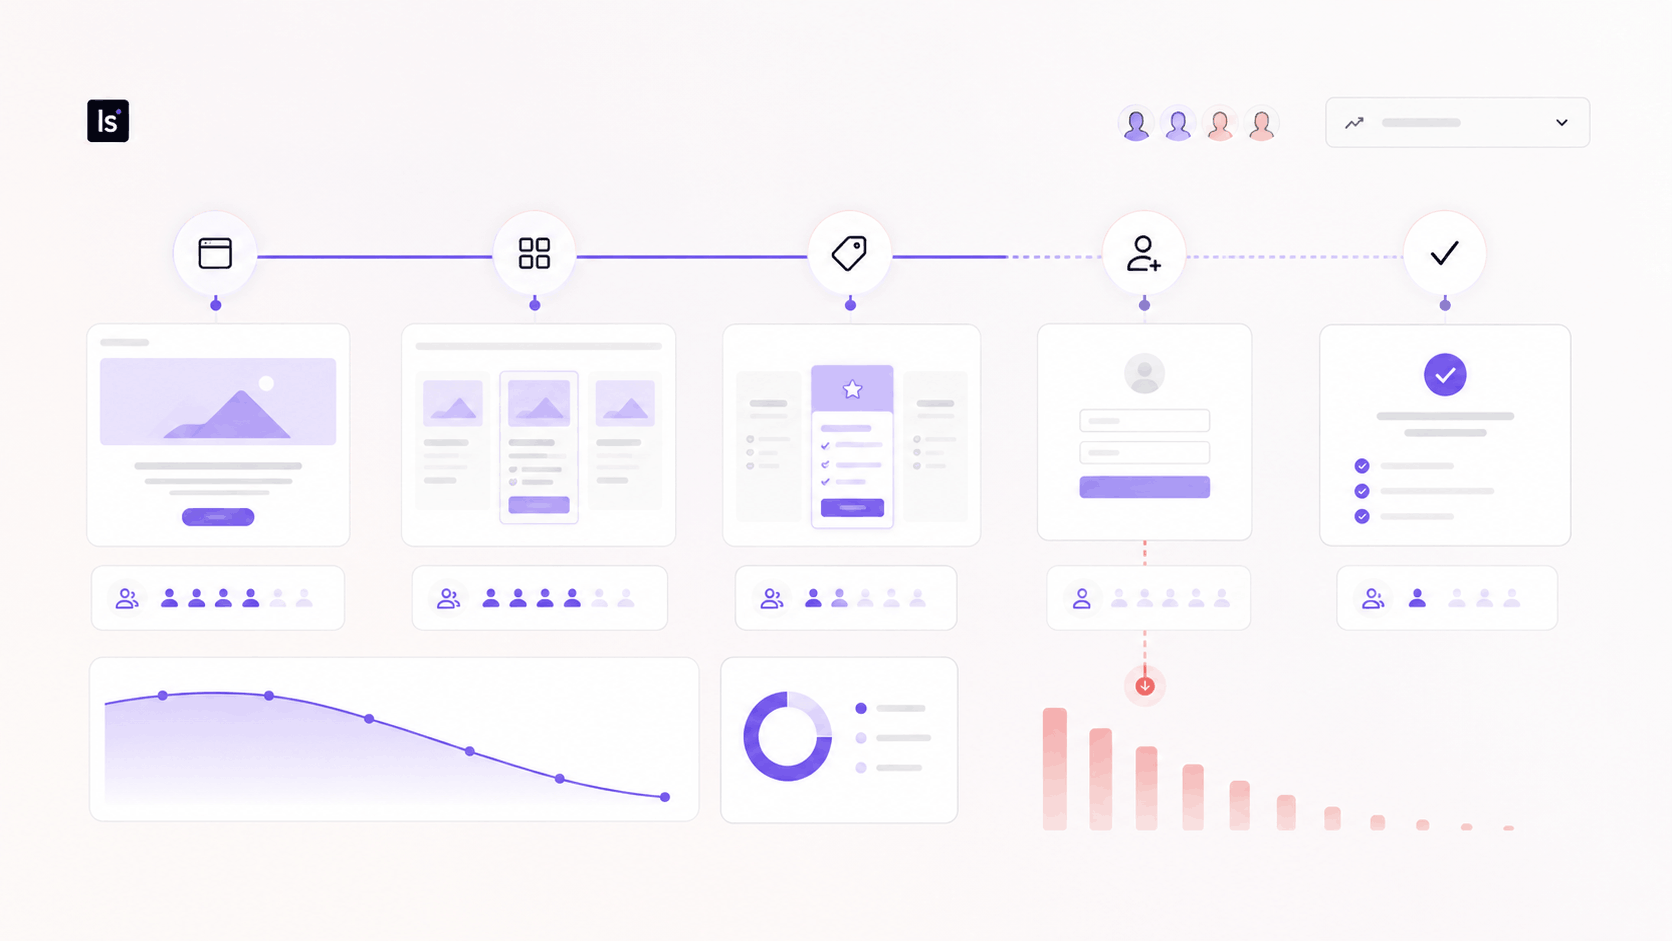
Conversion funnel analysis is the practice of measuring how many users complete each step on the path to conversion, so you can see where they leave. You define the steps, count the users who reach each one, and calculate the drop-off between each step.
A conversion funnel is the sequence itself. Someone lands on your site, views a pricing page, starts a signup, and completes it, signing a document electronically to seal the deal. Each of those is a funnel step, and each transition between them has a conversion rate you can measure.
The value sits in the comparison. An overall conversion rate tells you that something is wrong. Funnel analysis measures which specific step is wrong, which turns a vague problem into a scoped one.
Conversion funnel, sales funnel, and marketing funnel
These names get used interchangeably and they describe different things, which causes real confusion when teams compare numbers.
- A conversion funnel tracks on-site or in-product behavior toward a defined goal: a signup, a purchase, an activation event. It is measured in your product analytics or session replay tool.
- A sales funnel tracks deals through a pipeline, from lead to closed-won, and lives in your CRM.
- A marketing funnel tracks awareness and demand generation across channels before anyone reaches your site.
This guide covers the first one. If your drop-off happens between a demo request and a signed contract, you are looking at a sales funnel problem and your CRM holds the data.
The stages of a conversion funnel
The classic model runs through an awareness stage, an interest stage, a desire stage, and a decision to purchase. It is useful for describing intent, and less useful for analysis, because you cannot instrument "desire."
Build your funnel from events you can actually observe. For a SaaS signup, that might be a landing page view, a pricing page view, a signup form start, a form completion, and an activation event inside the product. For ecommerce, it runs from product page to cart to checkout to purchase.
For products that let prospects explore the interface before signup, interactive product demo software can introduce another measurable step between initial interest and registration.
The rule is that every stage has to correspond to something a user does that your tooling records. A funnel chart built on inferred intent produces numbers that look precise and mean nothing.
How to calculate conversion funnel rates
Two numbers matter at every stage.
Step conversion rate is the percentage of users who move from one step to the next. Divide the users who reached step two by the users who reached step one. If 4,000 people viewed your pricing page and 900 started a signup, that step converts at 22.5 percent.
Overall conversion is the percentage of users who enter the funnel and reach the end. Divide the users who completed the final step by the users who entered the first.
Step rates are where the diagnosis happens. Overall conversion is the number you report, and it moves only when a step rate moves.
How to analyze your conversion funnel
Define the steps before you look at the data
Decide what the funnel is measuring, in one sentence, before you open any tool. Is it a signup, a purchase, a subscription, an activation event? A funnel built to answer a specific question produces a specific answer. A funnel built to see what turns up produces a chart nobody acts on.
Check where users enter. If most people join at step three, your funnel definition is off, and your first step is measuring something other than the start of the journey.
Read the drop-off between each step
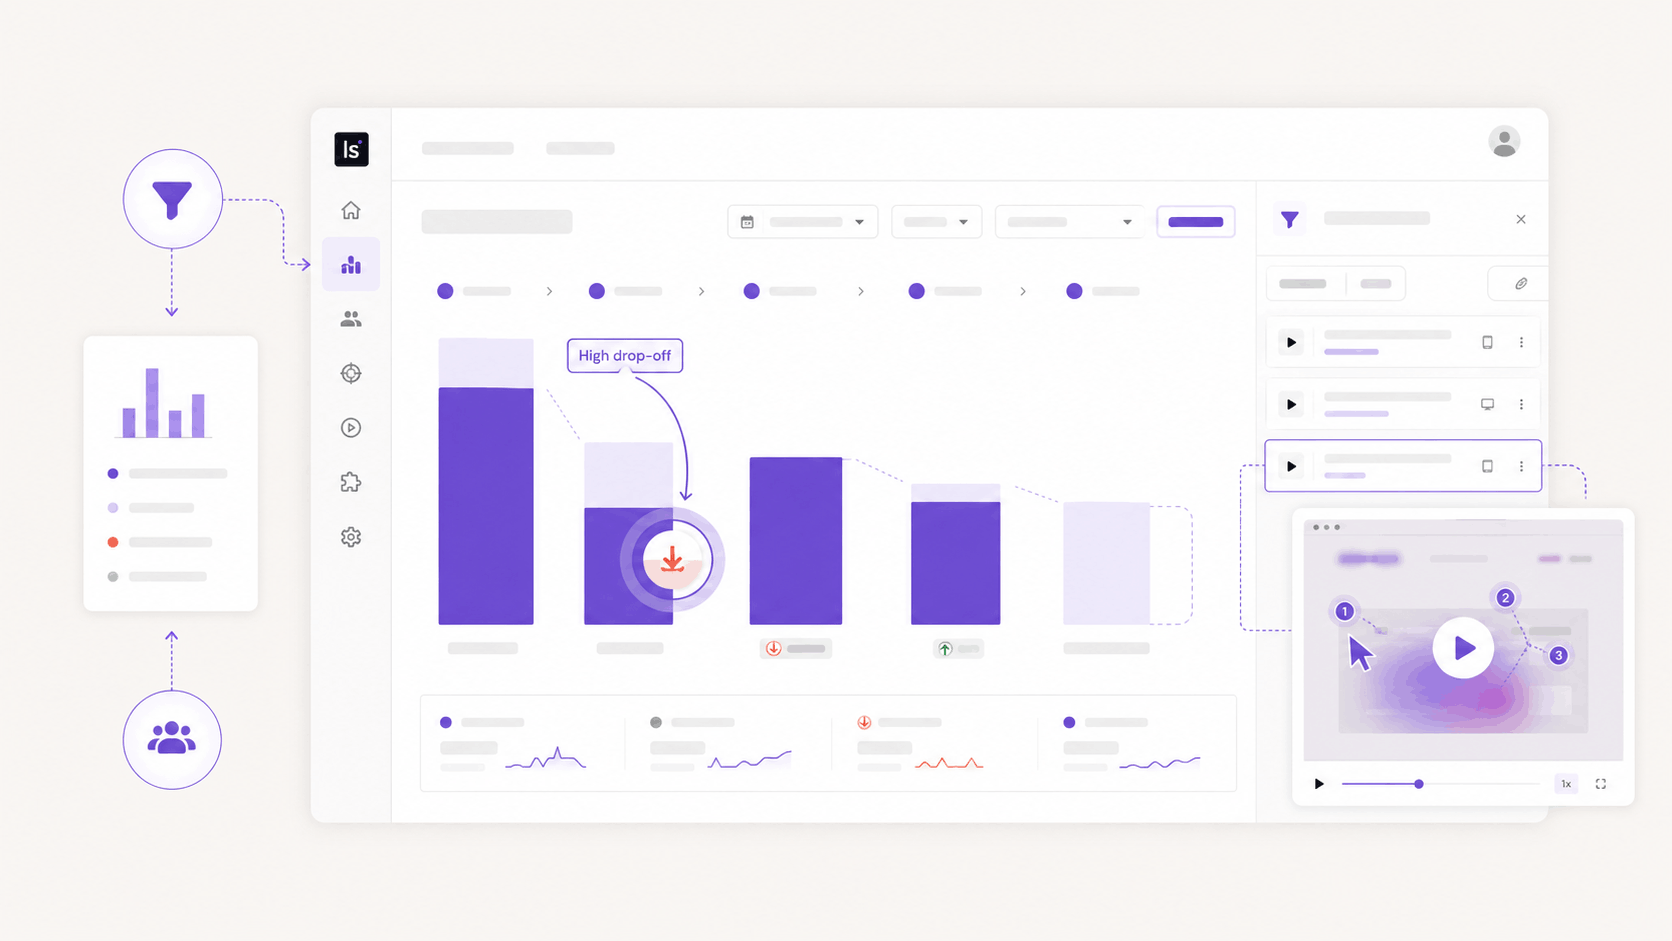
Scan for the step where the percentage falls hardest, and compare it against what you expected. A checkout step losing sixty percent is a different problem from a landing page losing sixty percent, because the users at checkout already told you they want to buy.
Watch for unexpected exits in the middle. Users who leave at the first step often lacked intent. Users who leave three steps in had intent and lost it, and that is where the money sits.
Segment before you conclude
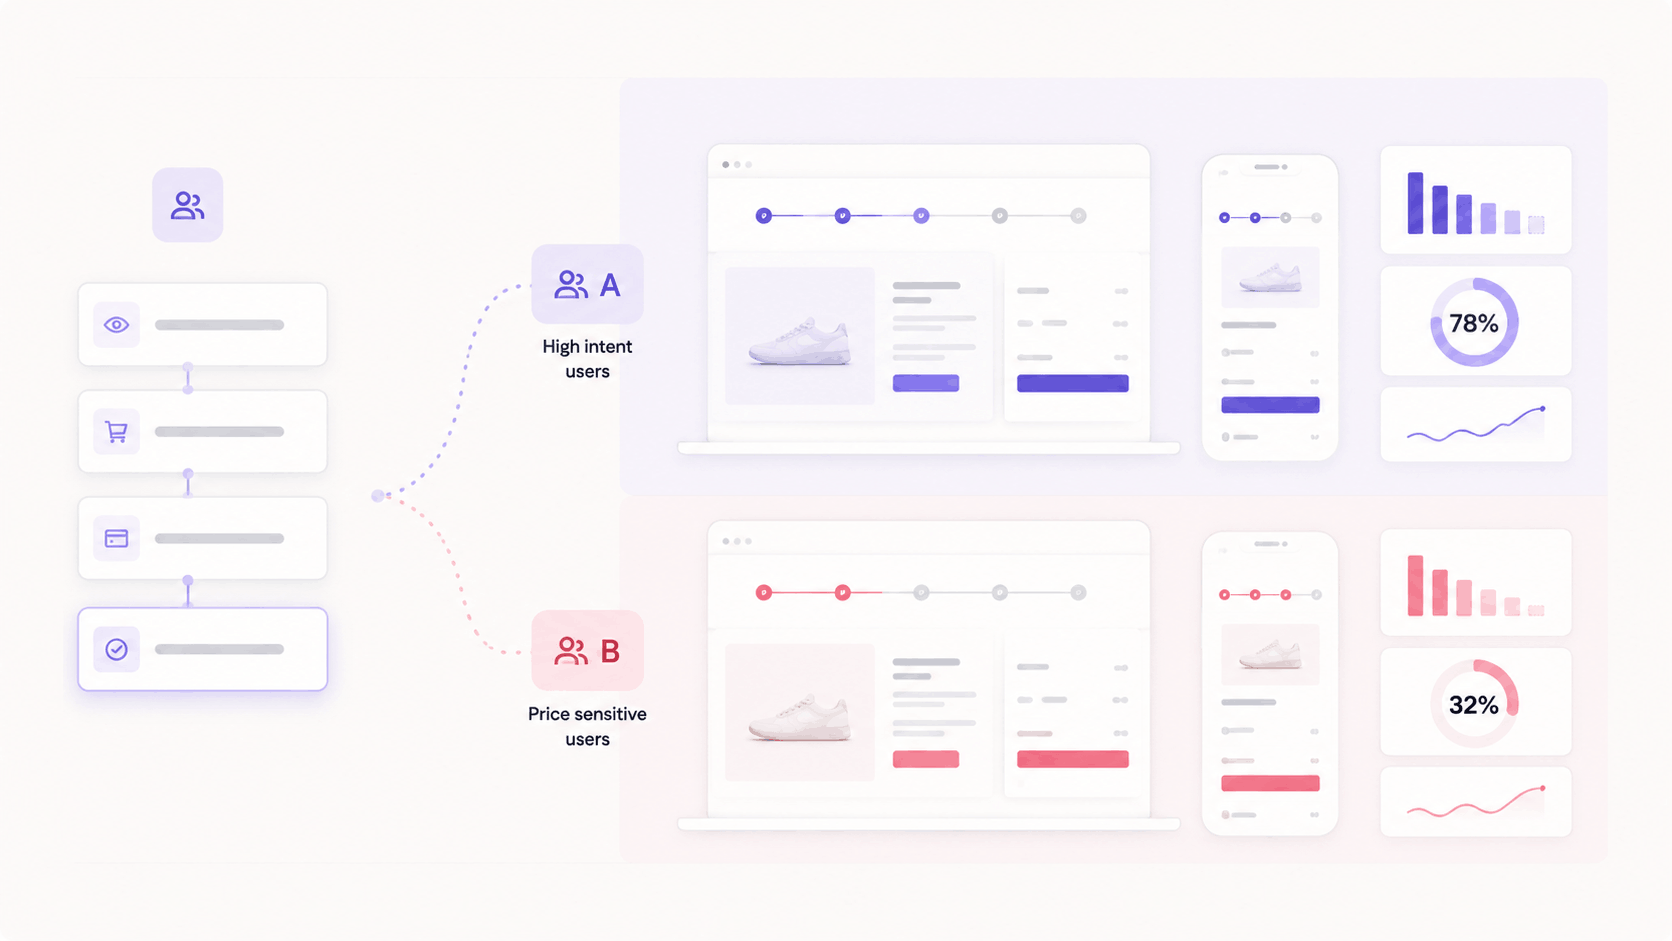
An aggregate funnel averages away the finding. Segmentation splits it by traffic source, device, plan type, or new versus returning, and the pattern usually appears immediately.
Mobile checkout converting at half the desktop rate is a specific, fixable problem. The blended number that contains both is not.
Watch session replays of the users who dropped
Your funnel data tells you which step leaks. It cannot tell you why, and every hypothesis you write from numbers alone is a guess.
Filter to sessions that entered the leaking step and left, then watch what happened. You will see the form field people abandon, the error message that appears too late, the button they clicked twice. This is where funnel optimization stops being speculation.
Common conversion funnel bottlenecks
Form friction accounts for a large share of mid-funnel loss. Fields that ask too much too early, validation that fires on the wrong event, and error states that appear below the fold all push people out of a flow they meant to complete.
Unexpected cost at checkout is the classic ecommerce bottleneck, and shipping charges revealed at the final step remain the most common single cause of cart abandonment.
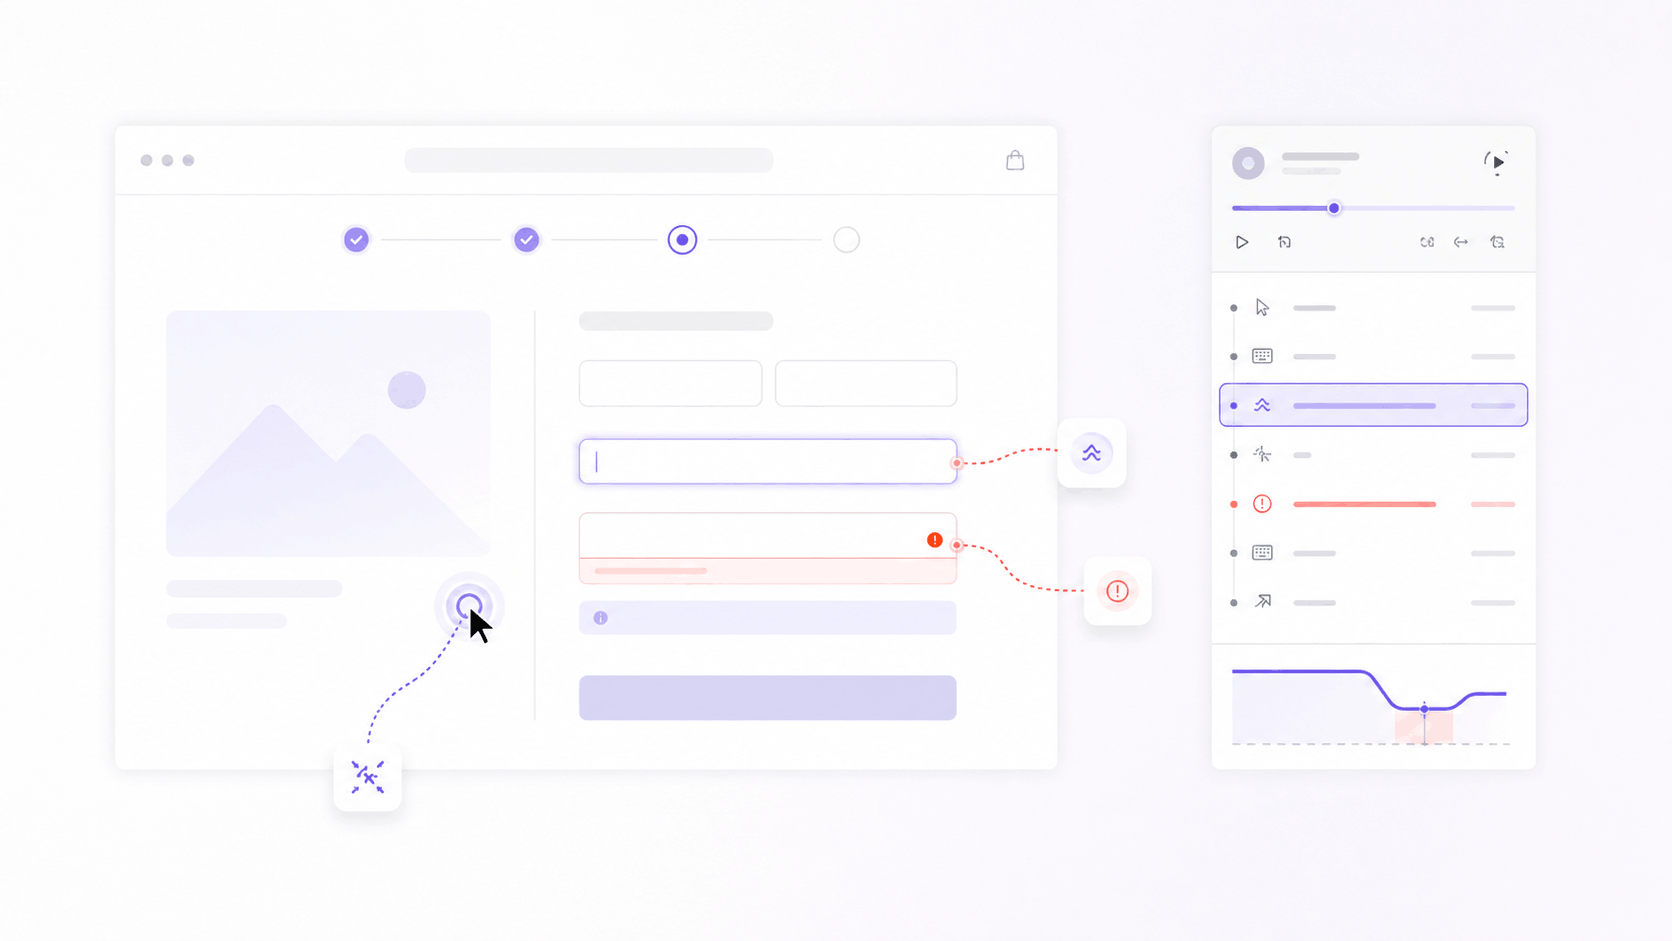
Unclear next steps stall users who are ready to continue. A CTA that blends into the page, or a step that gives no indication of how many remain, both produce drop-off from people who wanted to convert.
Technical failures hide in plain sight. A button with a broken handler, a payment provider timing out on one card type, or a page that loads slowly enough to lose patience will all show up as ordinary drop-off in your analytics.
What is a good conversion rate for a funnel?
There is no universal benchmark, and any number you read as one will mislead you. Funnel conversion varies by industry, traffic source, price point, and how many steps you chose to measure.
Ecommerce checkout completion commonly sits between forty and seventy percent. SaaS trial-to-paid conversion runs anywhere from two to twenty-five percent depending on whether the trial requires a card. A visitor-to-signup rate of two percent is healthy for cold traffic and poor for high-intent traffic.
Use your own history as the benchmark. The comparison that matters is this month against last month, and this segment against that one.
Where AI helps with conversion funnel analysis
AI-powered analysis has changed the speed of the diagnostic step, and it is worth being precise about where the gain actually is.
AI is good at surfacing anomalies across a large funnel data set, clustering sessions that share a behavior, and summarizing what a group of replays has in common. Work that took a marketer an afternoon of manual review now takes minutes, and AI session insights can point you at the ten replays worth watching out of four thousand.
AI is weaker at deciding what to measure. It will describe the drop-off it finds and will not tell you whether that funnel step reflects the business goal. It also inherits whatever your funnel definition assumed, so a badly defined funnel produces a confident, wrong summary.
Treat AI-powered conversion analysis as a way to narrow the search. The hypothesis, and the decision about what to change, stay with you.
How LiveSession helps you analyze conversion funnels
Most teams run funnel analysis in one tool and behavioral investigation in another, which means the answer to "why did they leave" lives a copy-paste away from the question.
LiveSession puts both in the same place. You define funnel steps from the events you already track, read the drop-off between each step, and then open the session recordings behind any segment of that chart with one click. The users who abandoned step three stop being a percentage and become forty recordings you can watch.
Frustration detection runs across those sessions automatically, so dead clicks, rage clicks, and JavaScript errors are flagged where they occur. When a funnel step leaks and the sessions inside it are full of error clicks, you have your cause and your fix in the same afternoon.
Heatmaps cover the page-level view for steps where the problem is layout instead of logic, and segmentation lets you split any funnel by device, source, or custom property to find the group that behaves differently. See what the platform includes, or start on the free plan.
Find the step that is costing you the most
Your overall conversion rate is a summary of decisions you have not seen yet. Break it into steps, segment it, and watch the sessions behind the worst one, and the fix usually turns out to be smaller than the number suggested.
Start your free trial of LiveSession and see where your funnel leaks.
Frequently asked questions
What is conversion funnel analysis?
Conversion funnel analysis is the practice of measuring how many users complete each step toward a conversion goal, then identifying the step with the largest drop-off. It converts a single conversion rate into a diagnosis you can act on.
How do you calculate a conversion funnel?
Divide the number of users who reached each step by the number who reached the previous step to get step conversion. Divide the users who completed the final step by the users who entered the funnel to get overall conversion.
What are the 5 stages of a conversion funnel?
The traditional model uses awareness, interest, desire, action, and retention. For analysis, replace these with observable events in your own product, since intent stages cannot be measured directly.
How is conversion funnel analysis different from customer journey mapping?
Funnel analysis measures a defined linear path using behavioral data. Customer journey mapping describes the full experience across channels and touchpoints, including steps that happen off your site. One is measurement, the other is a model.
What tools are best for conversion funnel analysis?
Event-based product analytics platforms such as Mixpanel show you the shape of the drop-off. Session replay shows you the cause. Teams that pair quantitative and qualitative data diagnose faster than teams running either alone.
How often should you run funnel analysis?
Review your core funnels monthly, and check them after any release that touches a step. A funnel that has been stable for a year still needs watching, because drop-off usually appears after a change nobody connected to it.
Related articles




Get Started for Free
Join thousands of product people, building products with a sleek combination of qualitative and quantitative data.