
How to use Product Usage Analytics in SaaS?


Your product team doesn’t know how a customer uses a product or feature and if it brings them value? Don’t know what next step to take in product development? Is your intuition telling you well, or do you have no idea at all?
Try never to make decisions without data-driven knowledge.
But how do you analyze product usage?
This article will answer that question for you.
Let’s get started.
- What is product usage analytics?
- Why is product usage analytics in SaaS so important?
- How do you start tracking product usage in SaaS?
- How to track feature usage, and how to make it more useful?
- Best tools for product usage analytics
- Product Usage Analytics Tool #1: LiveSession
- Product Usage Analytics Tool #2: FullStory
- Product Usage Analytics Tool #3: Hotjar
- Product Usage Analytics Tool #4: LogRocket
- Product Usage Analytics Tool #5: Heap
- Product Usage Analytics Tool #6: Amplitude
- Product Usage Analytics Tool #7: Mixpanel
What is Product Usage Analytics?
Product usage analytics is the process by which data about how users interact with a product is measured and analyzed.
Simply put, it is watching the user as they use the product. This allows you to find out what features of the product they are using, what their journey is like, and if or what value they are getting from the product.
This information will allow you to identify areas that need improvement or change. It also allows you to validate whether the product is evolving in the right direction.
Product usage analytics is the basis of product management and development.
Why is product usage analytics in SaaS so important?
A product team that doesn’t gain and retain knowledge about how users use a product can only rely on their gut feeling. Unfortunately, you can never step into a user’s shoes, doing so and developing the product is very risky. It may happen that unnecessary features will be added that nobody uses. This case, however, is not the worst because, in this situation, you can get rid of this feature. However, it will be worse when there are users who use it and have already invested their own effort in it. Withdrawing a feature is not so easy then, and the product team faces a big dilemma. For you may find that by withdrawing it, you cause customers who saw value in it to withdraw as well. And it’s not the loss of a customer that’s the worst part, but the damage to your company’s reputation.
So Product Usage Analytics is crucial if you want your product to develop in the right direction, not to create technological debt, and to give as much value as possible to your target group.
Well, the Target Group. Another important aspect of Product Usage Analytics is user segmentation. Different user groups may use a product in different ways. We’ll talk more about user segmentation in a future article.
Product Usage Analytics can help you determine:
- Which features are most popular.
- How sticky the feature is
- User engagement.
- The type of users who use the product most often.
- Whether users find value in the product.
- What critical points or problems do users encounter.
- Effectiveness of engagement strategies and campaigns.
- How and where exactly does the user clicks
- What his movement looks like
- What the user workflow looks like.
- Differences in product usage by different user segments.
- The results of A/B testing on user behavior.
This is not a complete list, but we hope it’s enough to prove that Product Usage Analytics in SaaS is simply essential, and every product team should take care of it.
How do you start tracking product usage in SaaS?
Every SaaS has a wealth of useful information in it’s database that can help inform decisions about further product development. However, extracting such data is time-consuming, and subsequent analysis is difficult and unpleasant given the unhelpful way they are visualized in the form of overloaded tables.
This is where product usage analytics software like LiveSession come into play. With dashboards and custom metrics, the product team can customize and visualize the data they need at any given time. Charts and tiles with statistics are much more fun to read the information they need, and we don’t have to be an expert in the field.
Although product managers have many necessary tools in their tool kit, product analytics tools are one of the most important, if not the most important. Thanks to them, they can make data-driven decisions that leave no doubt as to whether the direction they have taken is the right one.
In order to use such tools as LiveSession, all you need to do is add a tracking code to your product, which will allow you to collect data on the use of the product by users. From this moment, your Product Team can enjoy unlimited knowledge about the users of the product.
Thanks to custom events, you can measure user flow through particular processes, such as onboarding or subscription process. You can know which features are the most popular by setting metrics on the dashboard and checking the number of clicks and user engagement. You can track a user’s entire path, see where they clicked and if they had a problem with something, thanks to recordings of their sessions.
Interestingly, you can even check what was happening in the user’s console and if there were any javascript errors. Advanced filtering and segmentation allow you to view only the data you are interested in faster and easier. Not to mention the integrations with other tools that complete our knowledge of users.

How to track feature usage, and how to make it more useful?
Knowing the usage of specific features is very important. Your perceptions may be very different from reality. You have your expectations about specific features, but only with data can you be objective and critical about what you have developed or are about to build.
The most important information is whether the feature gives value to users. For this purpose, recordings of user sessions will be ideal, which can be easily filtered so that you do not have to watch the sessions that do not interest you at the moment. Certainly, customer interviews and Typeform surveys will be a great compliment.

Source: typeform.com
A common mistake product teams make to draw conclusions too quickly from quantitative data. This data may show you that not many users are using the feature, which may suggest that the feature doesn’t provide any value.
First of all, you need to find out why users don’t use it. After watching a few sessions and interviewing users, it turns out that they had no idea about the existence of such a feature. Then the product team can think about a clearer presentation; perhaps you need to lead users by the hand, explain, and engage. A great tool for engaging users in features is userpilot.
Once the right actions are established and implemented, you can track the results in a similar way. It’s a good idea to establish success metrics beforehand, by which you will know that our actions were effective, but we will write about metrics in another article.
Best tools for product usage analytics
There are many product analytics tools available in the market. The most important thing is to choose the best one for your needs. Here, let’s focus on the best tools for product teams in SaaS.
Product Usage Analytics Tool #1: LiveSession
LiveSession allows you to see how often a given functionality is used (Quantitative Data) and, more importantly, how users use it (Qualitative Data) by watching their session recordings.

You also don’t have to waste time watching low-value sessions because you can use advanced filters and create specific user segments you care about (e.g., only users that are part of your Ideal Customer profile)

You can also see what the user journey looks like and what % of users reach their goals. This allows you to see if they fall off at any step and watch their sessions to see what is causing them problems and what you can improve or change.

Use click and heat maps to see where customers clicked most often on your product. You can also filter out rage and error clicks, moments when users might have been frustrated.

LiveSession’s analytics capabilities are tailored to the needs of product managers, product designers, and UX researchers in SaaS. The insights gained will also help UX designers, developers, and marketers.
LiveSession is very easy to use. Adding a few lines of tracking code to the application takes 2 minutes. Already after this time, you can enjoy useful data. However, if you want to know the details of the user journey, you can use user identification, add custom events, create user segments, and even more.

In addition, LiveSession has a Dev Tools feature that allows you to see Javascript errors, detailed stacktraces, and logs, as well as record headers, request bodies, and response bodies for individual network requests. And all of this from within the user session.

There is a free plan available, but the most recommended is the Pro plan starting at $99 per month.
Want to get started with product usage analytics? Sign up for free and test LiveSession features.
Product Usage Analytics Tool #2: FullStory
FullStory is also a very powerful tool. Like LiveSession, they are becoming an increasingly comprehensive product analytics tool, allowing you to pull quantitative and qualitative data. Compared to LiveSession, it is less intuitive. FullStory is mainly designed for very large ecommerce companies.
In terms of features, it doesn’t differ strongly from LiveSession. Using FullStory you can:
- watch session recordings
- track custom events
- create funnels
- review clickmaps

Source: fullstory.com
There are no monthly plans, and annual plans start at $10,000 for 100K sessions.
Product Usage Analytics Tool #3: Hotjar
Another tool that allows you to analyze qualitative data is Hotjar. Compared to FullStory and LiveSession, Hotjar is less advanced. There are no filters, no Dev Tools, no custom events, no error clicks, and some other advanced options.
Using Hotjar you can:
- watch session recordings
- review heatmaps
- create surveys (recently available as a separate tool with separate pricing)

Source: hotjar.com
Without surveys, the price looks similar to LiveSession, but Hotjar has much less to offer. It is a tool dedicated to smaller companies that do not focus so much on Product Analytics.
Product Usage Analytics Tool #4: LogRocket
LogRocket is an analytics tool that is closer to FullStory and LiveSession. On the other hand, it is a tool aimed mainly at developers. Their strong point is front-end monitoring, which is the area they focus on the most. However, their weakness is UX. The interface is very technical and complicated. Product teams can get lost in it.
Using LogRocket, you can:
- watch session recordings
- monitor javascript errors with dev-tools
- create funnels
- review click maps
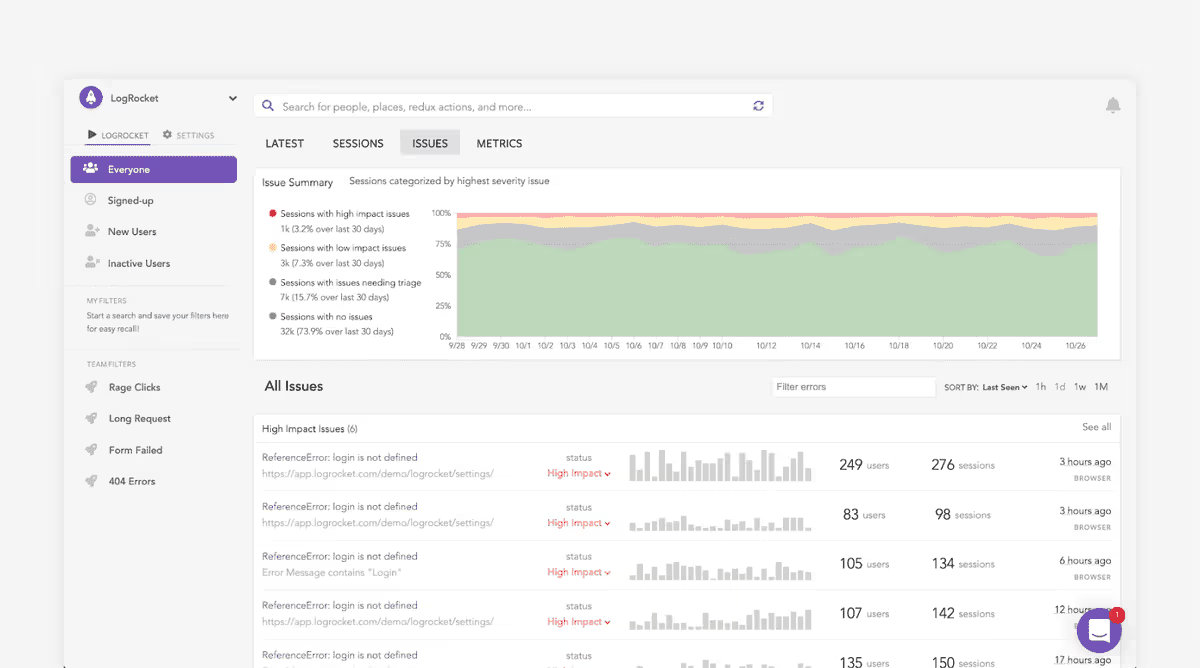
Source: logrocket.com
The Pro plan starts at $500 in comparison, and the Pro plan in LiveSession starts at $99 with similar features.
Product Usage Analytics Tool #5: Heap
Heap is a pretty advanced tool, mainly for quantitative analytics.
When you install Heap, you don’t have to configure everything right away. It collects data right away.
Using Heap, you can:
- track custom events
- create funnels
- measure retention
- analyze behavioral segments

Source: heap.com
The lowest-paid plan starts from about $375 per month.
Product Usage Analytics Tool #6: Amplitude
Amplitude is another powerful analytics tool. Like Heap, it collects mainly quantitative data.
Amplitude allows you to:
- cross-platform tracking
- real-time analytics
- behavioral analytics
- enterprise-level security measures

Source: amplitude.com
The lowest plan starts at around $1000 per month.
Product Usage Analytics Tool #7: Mixpanel
Again, a tool that specializes in quantitative data. Mixpanel is probably the most powerful product analysis tool of those listed above. However, it is also very complicated for the user. Its implementation and configuration are difficult. Mixpanel is dedicated to larger companies that can afford an army of product analytics experts.
Despite its many capabilities, it does not have a quality data collection function.

Source: mixpanel.com
Interestingly, the lowest plan starts at just $25 per month. However, don’t let that fool you. This is a minimal plan.
LiveSession may be sufficient for many SaaS, but it will work just as well as a complement to other product analytics tools.
Conclusion
We probably don’t have to convince you that Product Usage Analytics is the basis for building useful and valuable SaaS products. Every product team should know about it and practice it in their product. Knowledge about it allows you to make informed decisions and develop the product in the right direction.
Want to learn how LiveSession can help you make the most of your product usage data? Check out what we have to offer
Related articles


Get Started for Free
Join thousands of product people, building products with a sleek combination of qualitative and quantitative data.