
Visual Analytics Meaning: Definition, Process and Examples

Visual analytics is the practice of combining automated data analysis with interactive visual interfaces, so that a person can reason about large, messy data and reach decisions. The short academic version: it is the “science of analytical reasoning facilitated by interactive visual interfaces,” a phrase from the 2005 publication by James Thomas and Kristen Cook. The key word is interactive. A chart you only look at is visualization. A chart you filter, zoom, question and feed back into the analysis is visual analytics.
This guide explains what the term means, where it came from, how it differs from data visualization and dashboards, what the process looks like, and how product teams apply the same thinking to real user behavior.
What visual analytics means
Two ideas sit inside the term.
-
Analytics means computing: statistics, clustering, machine learning, anomaly detection. Computers are good at this across millions of rows.
-
Visual means that the results are shown in a form people can explore: charts, maps, networks, timelines, with controls to change what you see.
The IEEE Technology Navigator describes the discipline as one that combines automated data analysis with interactive visual representations to support human reasoning and decision-making over large, complex datasets. Neither side works alone. Algorithms find structure a person would never spot by eye. People bring context, suspicion and judgment that no algorithm has.
A simple way to hold it in your head: visual analytics is a conversation between an analyst and the data, with the screen as the table they talk across.
Where the term comes from
The field took shape in the early 2000s. According to Wikipedia’s overview, it emerged formally in 2004 to 2005 after initiatives by the US Department of Homeland Security’s National Visualization and Analytics Center. The 2005 Thomas and Cook research agenda gave it its standard definition. It grew out of two older fields, information visualization and scientific visualization, and it borrows from statistics, data mining, human-computer interaction and cognitive science. Research from Loughborough University describes it as a multidisciplinary field with interactive visualization at its core, which emerged from the need to analyze ever-growing, heterogeneous and often unstructured datasets.
The goal: find the expected and the unexpected
Daniel Keim, one of the field’s best-known researchers, and his co-authors frame the purpose in Visual Analytics: Definition, Process, and Challenges. Their point is that the problem is no longer collecting data. It is turning data into reliable, provable knowledge. Tools should help people synthesize information, detect the expected and discover the unexpected, even when the data is massive, ambiguous and conflicting.
That second half matters. A report answers the question you already had. Visual analytics is built for the question you did not know to ask.
Visual analytics vs. data visualization vs. dashboards
These three get mixed up constantly, including by software vendors. Here is how they differ.
| Data visualization | Dashboard / BI reporting | Visual analytics | |
|---|---|---|---|
| Main job | Show data in a visual form | Monitor known metrics | Support reasoning and discovery |
| Interaction | Often none or minimal | Filters, drill-downs | Central: the user steers the analysis |
| Computation | Usually light | Aggregations | Statistical and machine learning methods combined with the view |
| Typical question | “What does this look like?” | “How are we doing against the target?” | “Why is this happening, and what else is in here?” |
| Output | A picture | A status view | An insight plus the path that led to it |
An information systems paper on the topic draws the line this way: standard visualization focuses on representing data, while visual analytics focuses on the process of analytical reasoning, so the interaction is as important as the final insight.
There is a trap here. Many product teams treat visual analytics as a dashboarding feature. A chapter on human-centered computational analytics describes the real thing as an iterative “sense-making spiral”: you filter, zoom and label, and those actions steer the underlying algorithms toward patterns you did not expect, rather than only confirming what you already believed. A dashboard that nobody can question is a poster.
The visual analytics process
The process is a loop, not a pipeline. A typical pass looks like this.
-
Prepare the data. Collect, clean and transform it. Merge sources. Decide what each field means.
-
Get an overview. Show the whole dataset at a high level: distributions, trends, clusters, outliers.
-
Run automated analysis. Apply models, such as clustering or anomaly detection, to surface structure.
-
Explore interactively. Filter, zoom, change encodings, select a group of points and see what they share.
-
Form and test a hypothesis. Something looks odd. Is it real? Adjust the model or the data and look again.
-
Record and share. Keep the steps that led to the finding so others can check or repeat them.
-
Act, then return. A decision produces new data, and the loop starts again.
The Keim paper describes the same idea as the “visual analytics process,” in which data, models, visualization and knowledge feed each other and the user can move between them.
Why the human stays in the loop
What separates visual analytics from pure visualization or fully automated machine learning is the human-in-the-loop requirement. The Loughborough research above treats the system as an active partner rather than a passive tool. Analysts steer and correct the algorithms, and the IEEE overview puts it as treating the analyst as a participant who confirms and extends algorithmic structure through direct manipulation, not a passive reader of charts.
If you want a practical picture of that in another domain, this piece on understanding user behavior to shape AI-driven content strategy shows how people work alongside automated systems, reading behavior signals and deciding what to change, instead of handing the whole job to a model.
Provenance: remember how you got there
A less-discussed idea is analytic provenance: the system records the analysis itself, so it can be audited and re-run. A University of Utah preprint on reusing interactive analysis workflows points out that many visualization tools treat interactions as volatile, so they vanish when data reloads. Systems that persist the interaction history as reproducible steps let teams audit reasoning and collaborate. If your finding cannot be retraced, your colleague has to take it on faith.

What visual analytics looks like in practice
The field began with security and intelligence work, and it has spread widely. Some examples of what the term covers:
-
Urban planning. Researchers use interactive tools to explore city data such as mobility and environment. One framework for urban visual analytics argues that visual analytics has become essential for deriving insights into real-world societal problems.
-
Machine learning workflows. Studies of enterprise AutoML use look at visualization systems that keep humans in the loop, helping people explain and trust model output.
-
Planning and decision support. Government researchers at NIST have written about collaborative human and AI decision-making for mission planning, where analytical guidance has to be integrated with human decisions.
-
Business and product analysis. Teams explore funnels, cohorts, behavior paths and recordings to find out why numbers move.
The last one is where most of our readers live, so we will spend the rest of this guide there.
Visual analytics for product teams
A product team has two kinds of evidence. Quantitative data says what happened: 38% of people who start onboarding never finish. Qualitative data says why: you watch a handful of those people hesitate on the same field, rage-click a disabled button, or hit an error that never reached your logs. Visual analytics thinking says to join them in one loop.
A workable pattern:
-
Start with a visual overview. Look at a conversion funnel or an event trend. Find the step with the unexpected drop. Our guide to product analytics covers the metrics worth watching first, and 20 core events to start with gives you a concrete event list.
-
Filter until the pattern sharpens. Split by device, plan, acquisition channel, or app version. Interactivity is the point: each filter is a question.
-
Look at behavior, not just counts. Open session replays for the segment that drops off. Check heatmaps and click maps to see where attention and clicks go, and where they go wrong.
-
Form a hypothesis and test it. Say the drop is concentrated on one browser. Fix the issue, ship, and watch the same funnel.
-
Write down what you learned. Save the segment, the view and the conclusion so the next person does not start from zero.
Notice what that is. It is the visual analytics loop applied to a product: overview, filter, details on demand, hypothesis, record, act.
A worked example
Imagine a project management app where trial users must invite a teammate. The funnel shows a sharp fall at the invite step. A static report would say “invite step conversion is low” and stop.
In an exploratory workflow you would split the step by device and find the drop is far worse on mobile. You would open a few mobile sessions from that segment and see the invite button sits under the keyboard. You form a hypothesis, move the button, release the change, and compare the funnel afterward. One chart led to a question, a segment, a recording, a fix and a check. That chain is the whole idea. (This example is illustrative, not a customer result.)
Common mistakes
-
Treating the dashboard as the finish line. If a view cannot be filtered or traced to the underlying sessions or events, it can only confirm what you already suspected.
-
Looking only for confirmation. The sense-making idea above exists to catch surprises. Reserve time to explore without a target.
-
Ignoring the data’s origin. A beautiful chart on bad tracking is still wrong. Agree on event definitions before you analyze. Our guide to event analytics explains how to structure them.
-
Losing the trail. If findings live in someone’s head, the analysis cannot be reproduced. Save views and write the reasoning next to them.
-
Over-trusting automation. Models flag anomalies, but a person must decide whether an anomaly is a bug, a campaign or a quirk.
Our perspective
We build for product managers, designers, developers, UX researchers and marketers, and the pattern we see is consistent: teams rarely lack charts. They lack the step between the chart and the explanation.
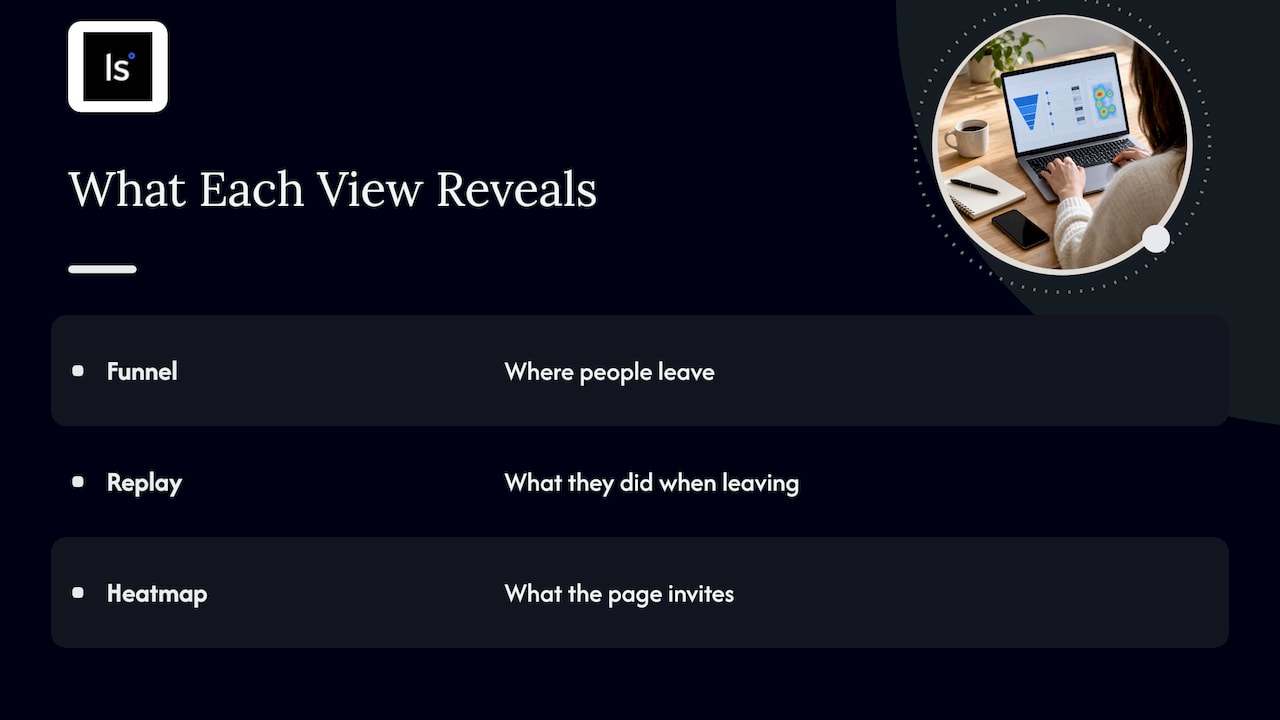
That is why we pair qualitative and quantitative views in one place. A funnel tells you where people leave. A replay shows you what they were doing when they left. A heatmap shows you what the page invites them to do. Each is useful alone, and each is far more useful when you can jump from one to the next without exporting anything.
We also think the term “visual analytics” gets stretched by software marketing until it means “has charts.” Our test is simple: can the person looking at the screen ask a follow-up question and get an answer in a few clicks? If yes, you are doing analysis. If not, you are reading a report.
Finally, privacy belongs inside the loop, not after it. Watching real sessions is powerful, so teams need to be careful about what they capture and who sees it. We design with GDPR and CCPA compliance in mind for that reason.

Try the approach on your own product
If you want to apply this loop to your own users, LiveSession combines session replay, heatmaps, conversion funnels, event-based analytics, error tracking and customizable dashboards, with integrations such as Intercom, Zendesk, Shopify and Segment. You can start on the free plan and compare the paid tiers on the pricing page. To see how the qualitative and quantitative pieces fit, look at our solutions overview.
FAQ
What is the meaning of visual analytics?
Visual analytics is the science of analytical reasoning supported by interactive visual interfaces. It joins automated analysis, such as statistics and machine learning, with visual views a person can manipulate. The aim is to understand large, complex data and make better decisions.
What is the difference between data visualization and visual analytics?
Data visualization focuses on showing data in a visual form. Visual analytics goes further: it centers on the reasoning process, with interaction, computation and human judgment working together. A bar chart is visualization. Filtering that chart, running a model on a selected group and saving the steps is visual analytics.
What are the characteristics of visual analytics?
The main traits are interactivity, a human in the loop, combination of automated analysis with visual views, support for exploring unexpected patterns, and, in stronger systems, a record of the analysis so it can be repeated and audited.
Who uses visual analytics?
Researchers, government agencies, analysts in finance and healthcare, city planners, data scientists and business teams. Product teams use the same ideas when they explore funnels, event trends and session recordings to understand user behavior.
Is a dashboard visual analytics?
Not by itself. A dashboard that only displays fixed metrics is reporting. It becomes part of visual analytics when users can interact with it, drill into the underlying data and use it to test hypotheses.
Sources
-
What is Visual Analytics? (LAVA, University of British Columbia)
-
Use of performance predictors in visual analytics (Loughborough University)
-
Visual Analytics: Definition, Process, and Challenges (University of Konstanz)
-
Information systems literature on visual analytics (AIS eLibrary)
-
Immersive Human-Centered Computational Analytics (Simon Fraser University)
-
Urbanite: Human-AI Interactive Alignment in Urban Visual Analytics
-
Fits and Starts: Enterprise Use of AutoML and the Role of Humans in the Loop
-
The Future of Collaborative Human-AI Decision-Making for Mission Planning (NIST)
Related articles



Get Started for Free
Join thousands of product people, building products with a sleek combination of qualitative and quantitative data.