
8 Best Heatmap Tools: Ultimate Guide Heatmaps & Analytics Software

Introduction to Heatmap Tools
Heatmap tools have evolved into essential instruments for understanding user behavior, offering visual insights into how visitors interact with websites and apps. In 2025, these tools cater to diverse needs—from eCommerce brands optimizing conversions to product teams refining UX. This article explores the best heatmap tools, highlighting their strengths, use cases, and limitations to help you choose the right one for your goals.
How We Evaluate and Compare Apps
Criteria we used:
- Best for: Identifies the ideal user or use case for each tool.
- G2 Ratings: Reflects user satisfaction and common pain points based on G2 scores and reviews.
- Key Features: Focuses on unique or standout functionalities and their value to users.
- Pricing Information: Details starting costs and free trial availability.
- Pros and Cons: Summarizes strengths and weaknesses for balanced decision-making.
Top List of the Best Tools for Heatmap Analysis
- LiveSession – Best for design-savvy product teams seeking rapid, actionable insights.
- Hotjar – Best for marketers prioritizing quick feedback over deep data.
- Mouseflow – Best for lean teams needing affordable basics.
- Smartlook – Best for small product teams wanting easy session replays.
- Fullstory – Best for enterprises managing large digital portfolios.
- Lucky Orange – Best for CRO teams needing real-time UX insights.
- Microsoft Clarity – Best for budget-conscious teams seeking free basics.
- heatmap.com – Best for eCommerce brands tracking revenue impact.
Best for Design-Savvy Product Teams: LiveSession
Best for
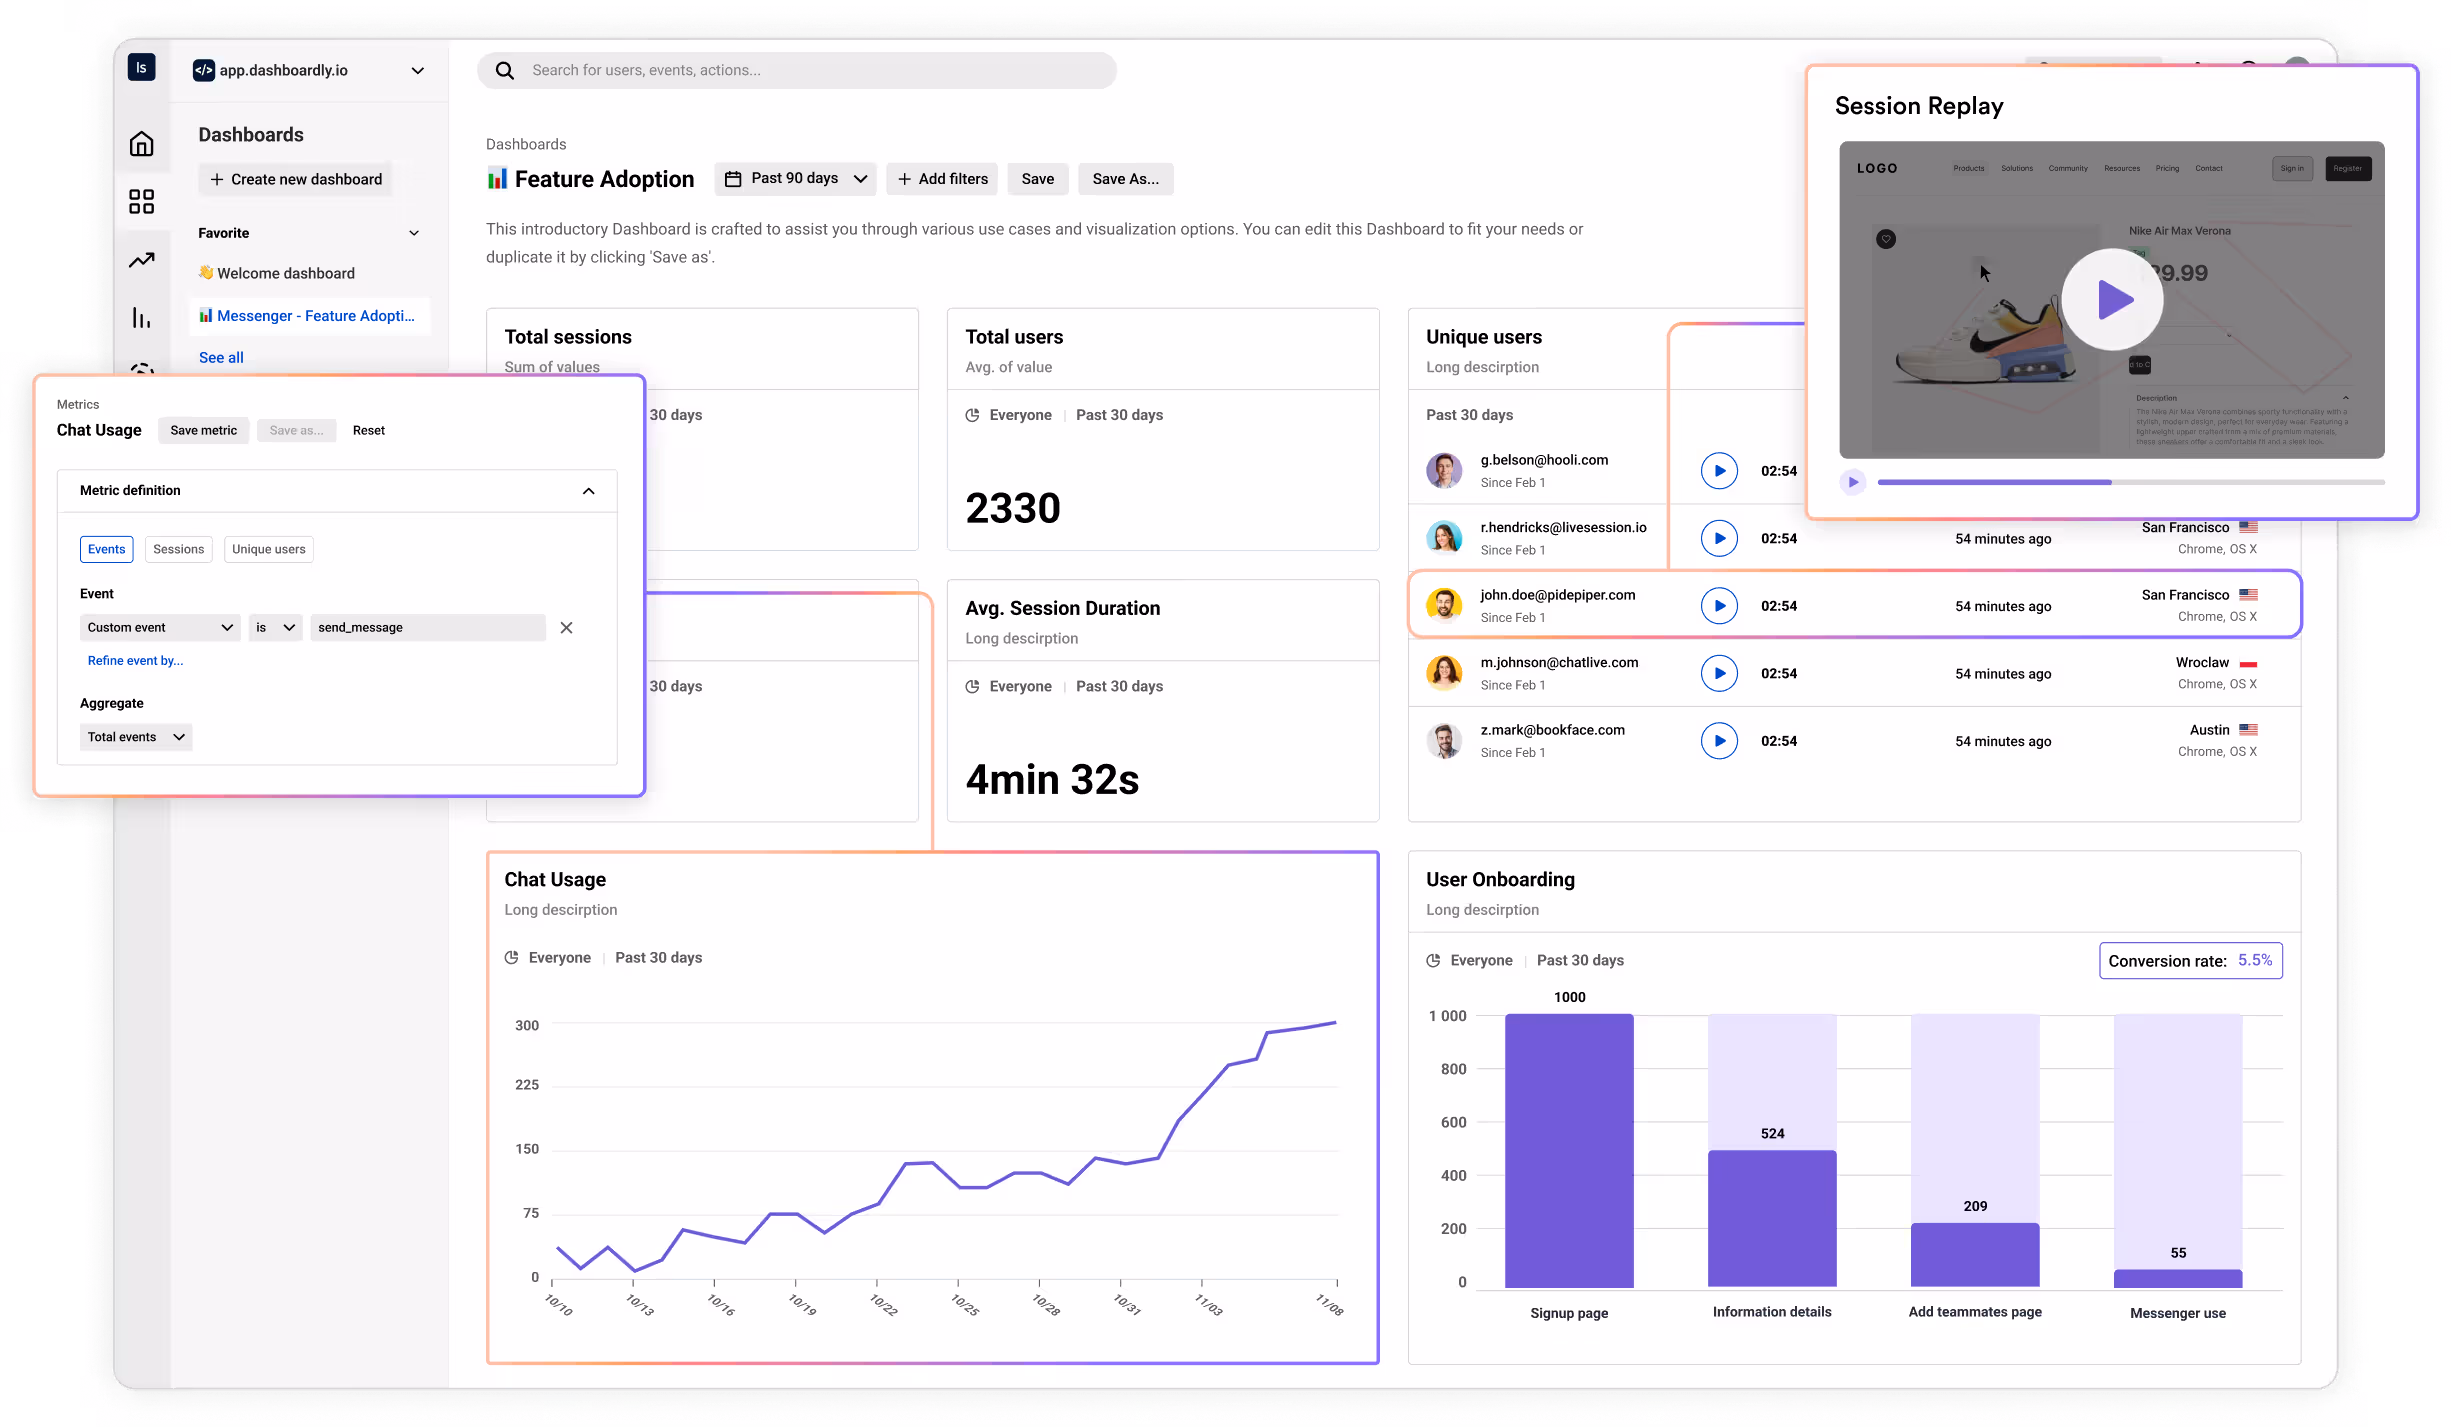
LiveSession is a behavior analytics tool designed for teams seeking rapid and actionable insights into user behavior. Its primary audience includes product teams, UX designers, and marketing professionals who value sleek app design and cost-effective session tracking. This tool enables teams to analyze user interactions on websites and mobile apps effectively.
G2 Ratings
LiveSession holds a G2 score of 4.6/5, reflecting strong user sentiment towards its price-to-value ratio, ease of use, and overall UI design. However, some users have expressed dissatisfaction with the platform's lack of advanced features compared to competitors, indicating a need for more comprehensive analytics tools.
Key Features
- Session Replays: Allows teams to review user interactions in real-time, providing insights into user experience and identifying friction points.
- Advanced Filtering: Enables users to segment data effectively, allowing for more targeted analysis of user behavior.
- Dev Tools: Provides developers with essential tools to troubleshoot issues directly from session replays.
- Heatmaps: Visualizes how users interact with your website, helping identify which areas attract attention.
- Custom Dashboards: Offers flexibility in displaying key metrics, making it easier to analyze website traffic and conversion rates.
Pricing Information
- LiveSession offers a free plan for basic features
- Starting at $65 per month
- A 14-day free trial allows users to explore its capabilities before committing.
Pros and Cons of Using LiveSession
- Pros include quick insights into user behavior, an excellent user interface, and strong value for cost.
- However, the cons include a potential lack of advanced analytics features, which may deter teams needing comprehensive data analysis tools.
Summing up LiveSession is one of the best heatmap tools available.
Best for Marketers Seeking Quick Feedback: Hotjar
Best for
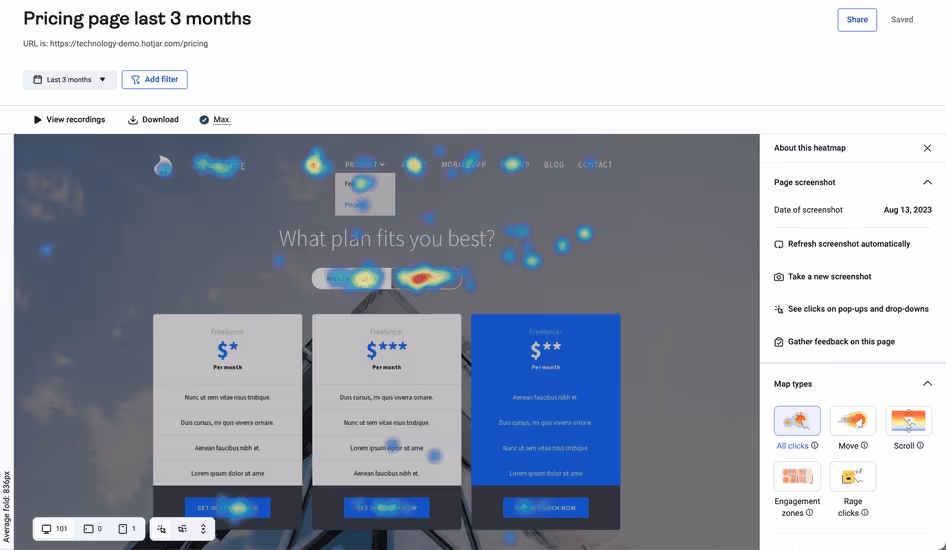
Hotjar is a behavior analytics tool designed to help marketers understand how users interact with their websites and mobile apps. It is particularly suited for those who prioritize heatmaps and quick feedback over in-depth analysis. Its typical audience includes digital marketers, UX designers, and product managers looking to optimize user experience and conversion rates.
G2 Ratings
Hotjar currently holds a rating of 4.3/5 on G2, reflecting a generally positive user sentiment. Users appreciate its ease of use and quick setup; however, many express frustration with the limitations of the free version and the caps on daily sessions, which can hinder comprehensive analysis.
Key Features
- Heatmaps: Visualize where users click, scroll, and move on website pages, providing valuable heatmap data to analyze user behavior.
- Session Recordings: Replay visitor sessions to observe how users interact with your website, offering insights into user experience and areas for improvement.
- Surveys: Gather direct feedback from users, enabling marketers to understand user needs and pain points effectively.
- Frustration Scores: Identify problem areas in user interactions, allowing teams to address issues that may negatively impact conversion rates.
Pricing Information
- Hotjar’s pricing starts with a free tier that allows limited functionality
- Starting at a competitive rate per month
- Paid plans provide access to more advanced features and higher session capacities.
Pros and Cons of Using Hotjar
- Pros: Fast setup and a user-friendly interface make it accessible for non-technical users.
- Cons: The insights can be superficial, particularly for complex web applications, and it struggles to compete with more robust analytics tools like Google Analytics or Adobe Analytics.
Overall, while Hotjar serves as a useful website heatmap tool, it may not meet the needs of all users seeking comprehensive analytics features.
Best for Beginners: Mouseflow
Best for
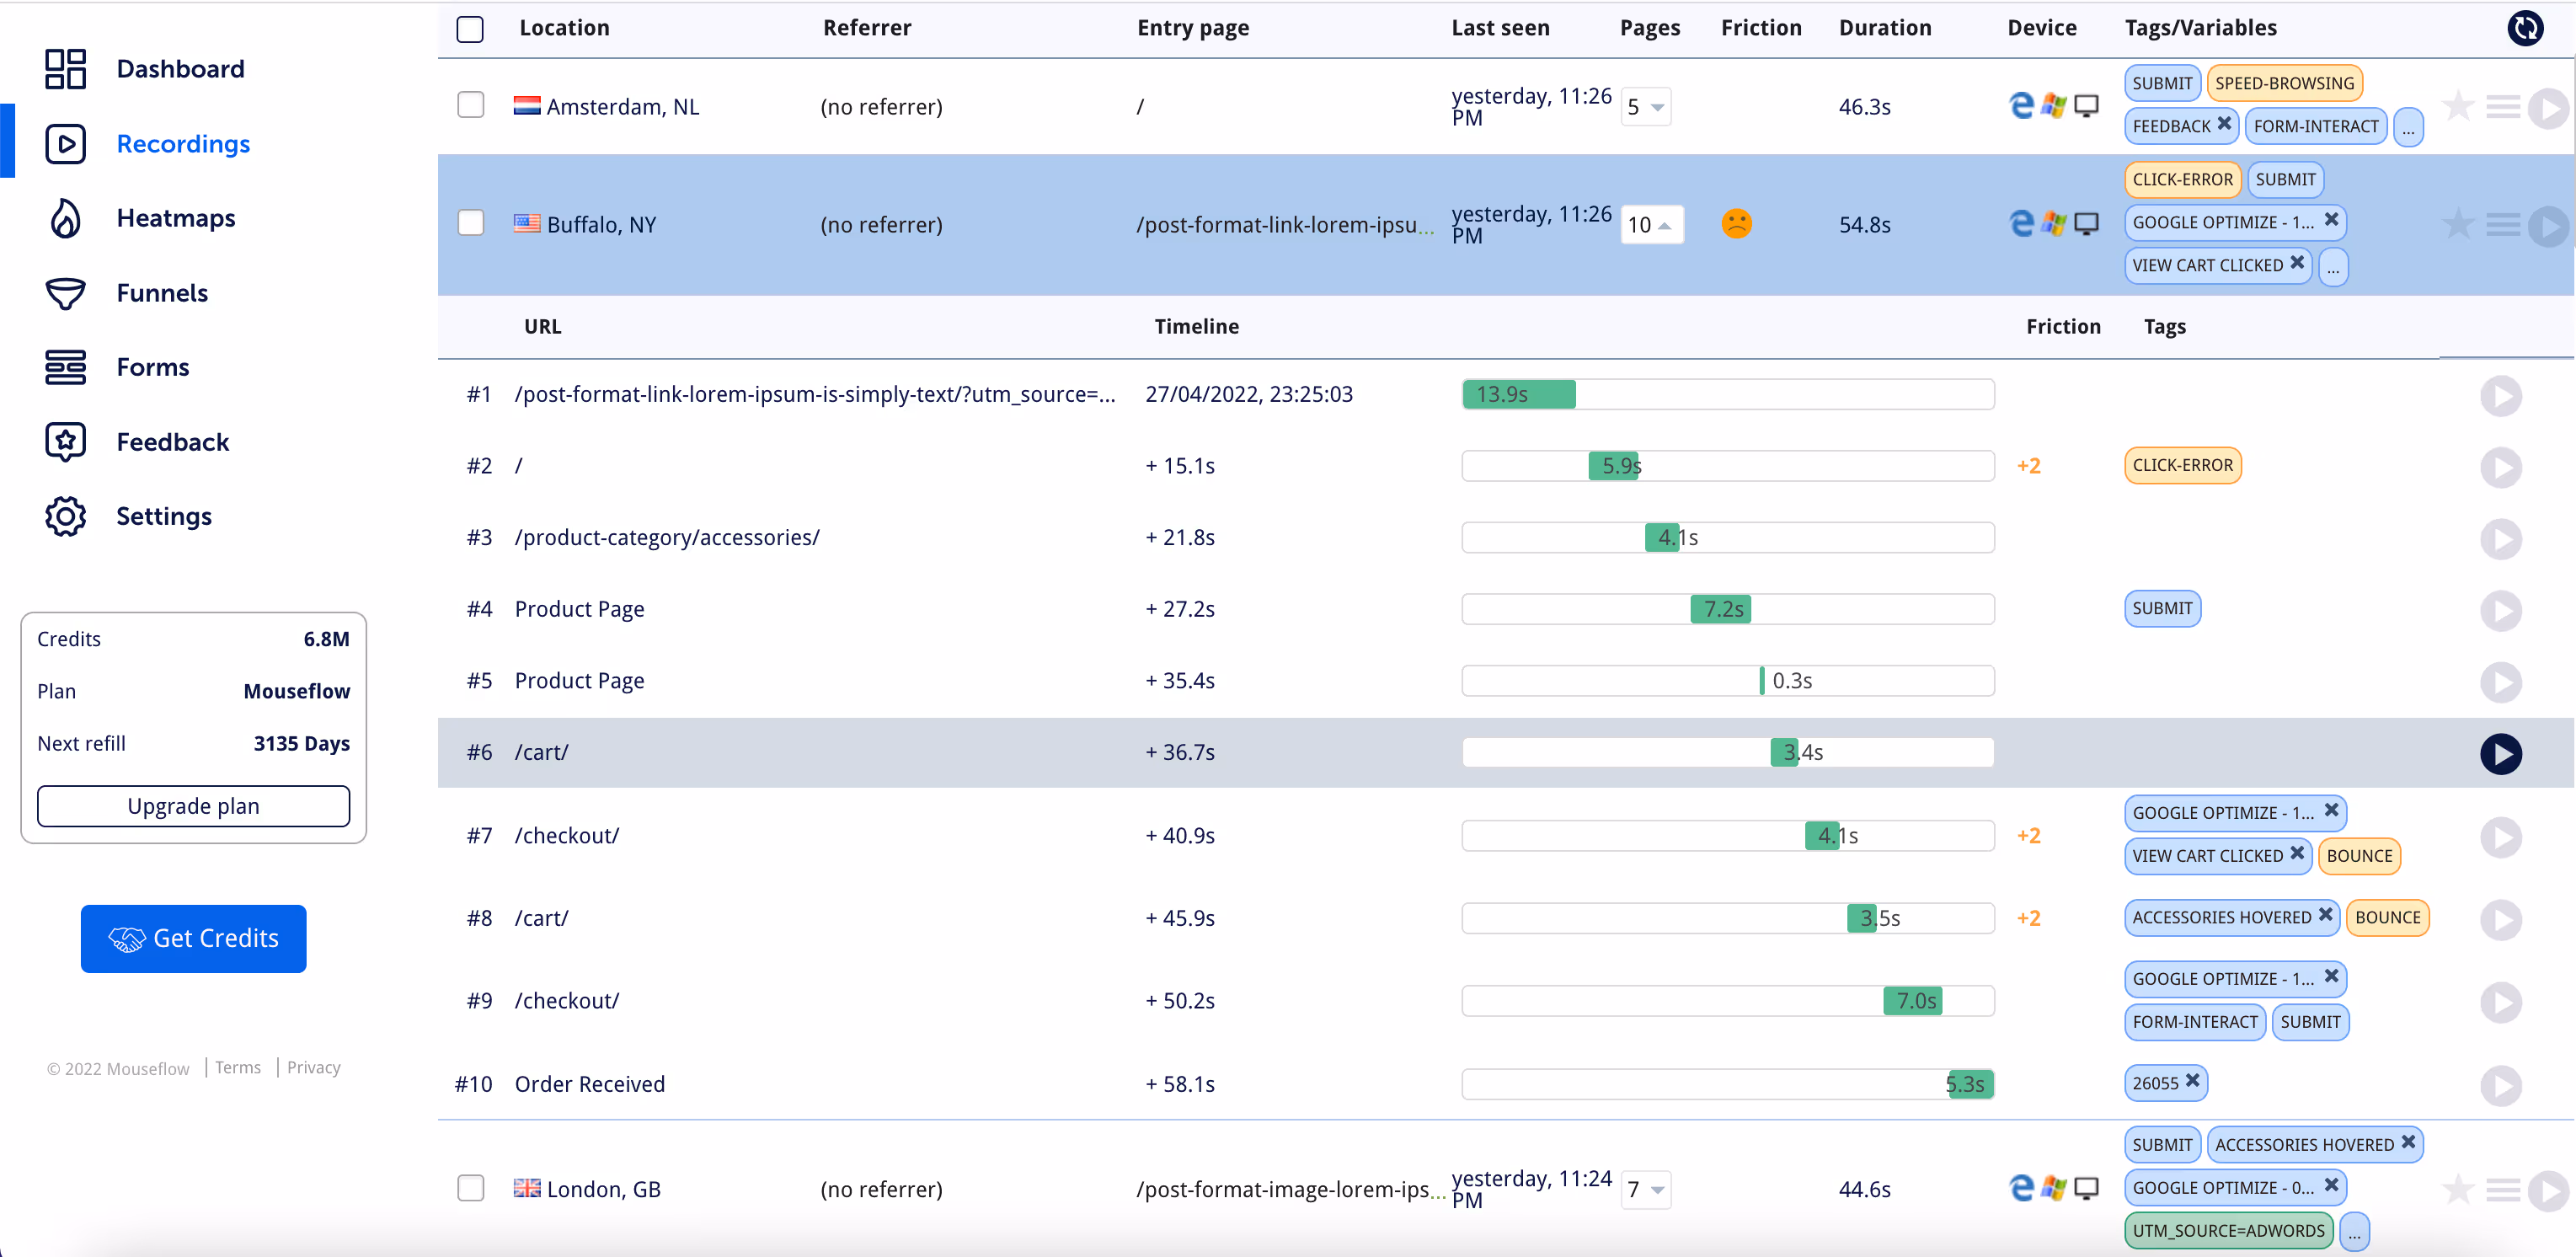
Mouseflow is a web analytics tool designed primarily for lean teams seeking affordable click and funnel tracking solutions. It is particularly suited for small to mid-sized businesses that require basic behavior analytics to improve user experience and optimize website performance. Mouseflow allows users to gain insights into how website visitors interact with their sites through various analytics features.
G2 Ratings
Mouseflow boasts an impressive G2 score of 4.6/5, with users praising its cost-effectiveness and essential functionalities. However, many have criticized the software for bugs and inadequate mobile analytics, which can hinder its usability. This mixed sentiment suggests that while it meets basic needs, it may not be reliable for more complex analytics tasks.
Key Features
- Session Replays: This feature allows users to watch recordings of user sessions, helping to identify usability issues directly.
- Heatmaps: Different types of heatmaps, including attention and scroll heatmaps, provide visual insights into user behavior, improving website optimization.
- Conversion Funnels: Funnel analysis tools enable users to track the journey of visitors, pinpointing where drop-offs occur.
- Form Analytics: This tool helps analyze how users interact with forms, allowing for enhancements that can increase conversion rates.
Pricing Information
- Mouseflow offers a free plan, making it accessible for beginners
- Starting at $39 per month
- The entry-tier option has limited features, which may restrict its effectiveness for comprehensive analytics.
Pros and Cons
- Pros:
- Low-cost solution that covers essential needs for website analytics.
- User-friendly interface suitable for beginners.
- Cons:
- Frequently encountered bugs can disrupt functionality.
- Outdated user interface may not meet modern design standards.
- Lacks advanced capabilities found in more robust analytics software, limiting its use for in-depth analysis.
In conclusion, while Mouseflow presents a viable option for beginners seeking basic website heatmap and analytics tools, its limitations in performance and features may deter more advanced users.
Best for Small Product Teams: Smartlook
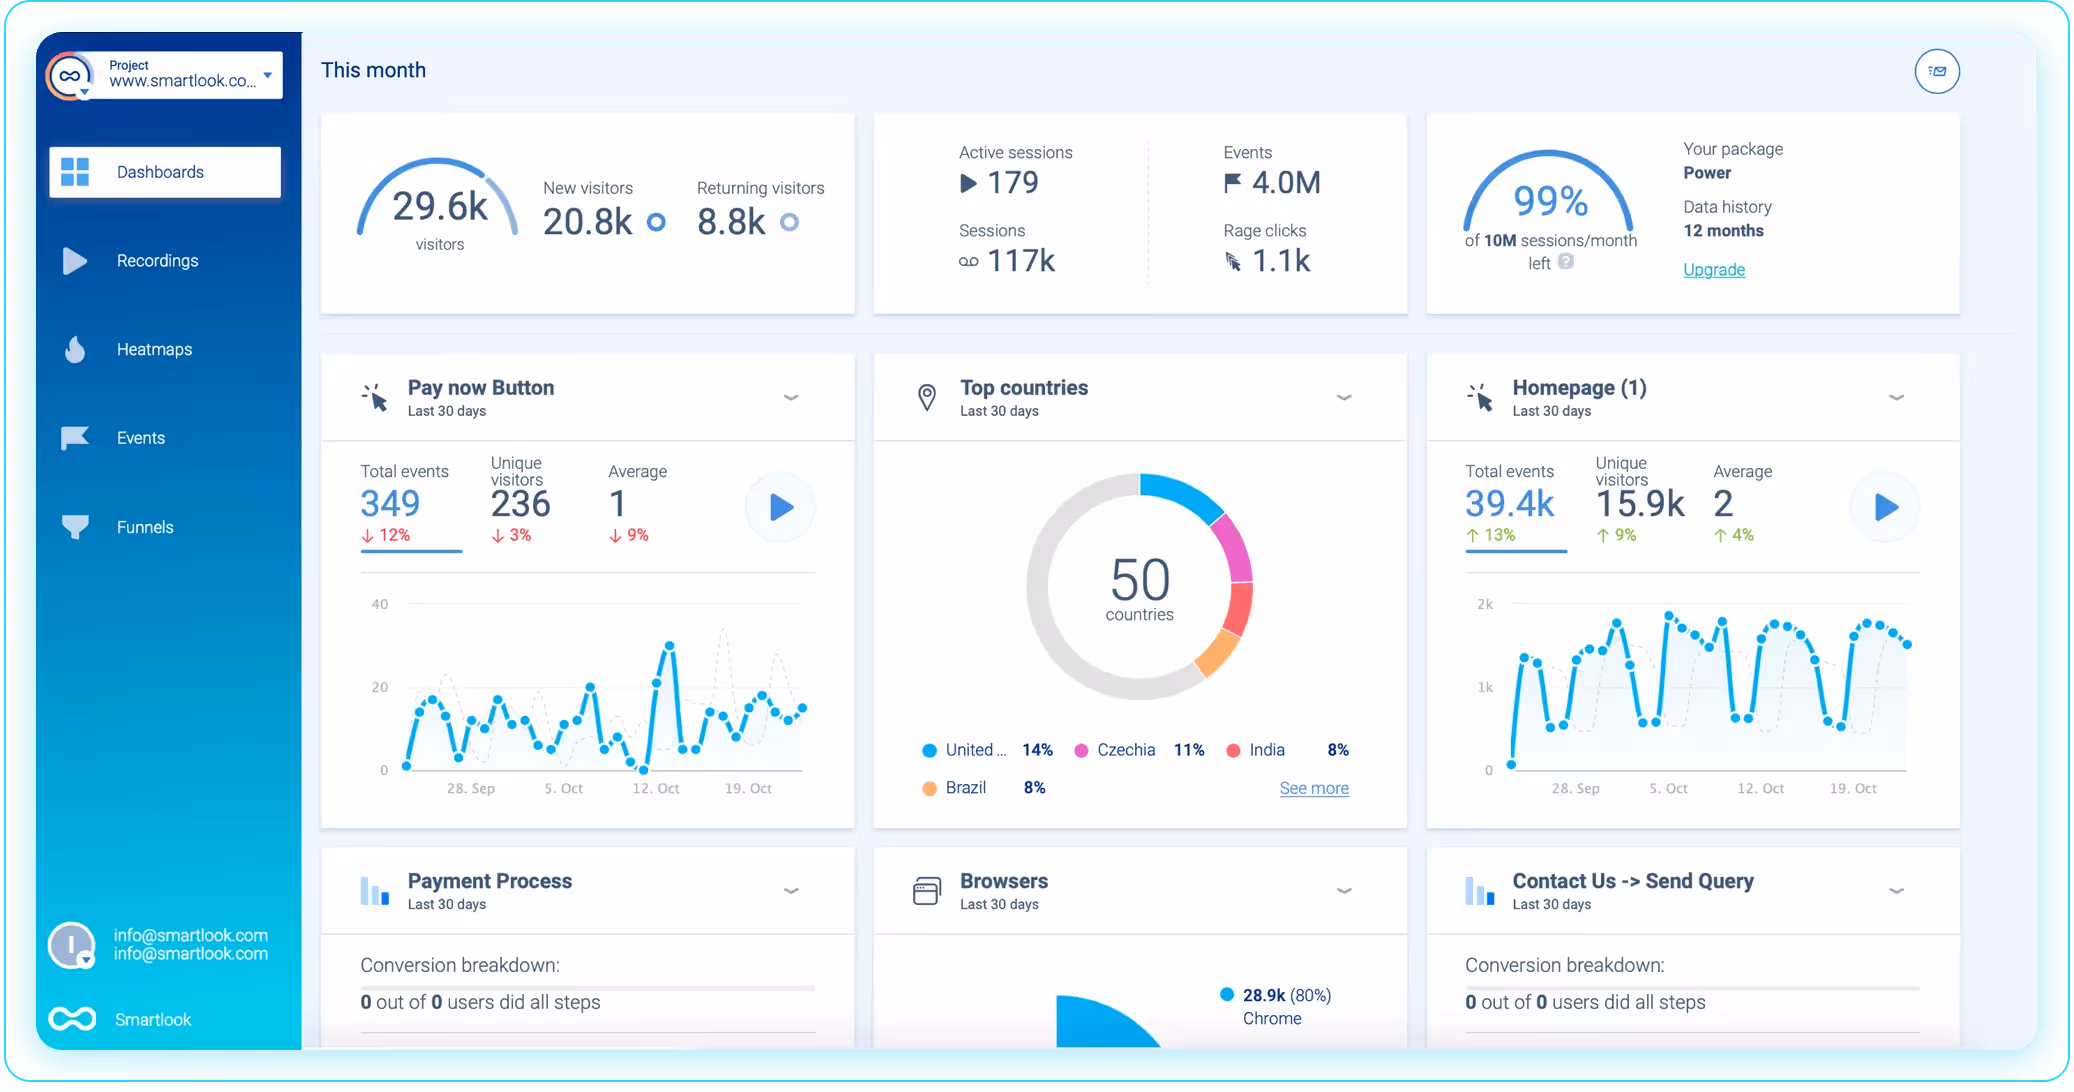
Best for
Smartlook is a behavior analytics tool designed primarily for mobile app product teams. It offers insights into user interactions through features like session replay and heatmap analytics, making it suitable for developers and product managers seeking to optimize user experience and engagement.
G2 Ratings
Smartlook holds a G2 rating of 4.6/5, which reflects a generally positive user sentiment. However, users have reported that lower-tier plans may lack essential features, impacting smaller teams who may not be able to access the full potential of this best heatmap software.
Key Features
- Session Recordings: Allows teams to replay user sessions, providing clear insights into user behavior.
- Event Tracking: Enables tracking of specific actions, helping teams understand user journeys.
- Basic Funnels: Offers a simplified view of conversion paths, though not as robust as other funnel analysis tools.
- Heatmaps: Visualizes user interactions, such as clicks and scrolling, aiding in website optimization.
Pricing Information
- Smartlook offers a free plan, which is a great starting point for teams
- Starting at $69 per month
- Paid plans may be steep for smaller teams seeking comprehensive functionality.
Pros and Cons
- Pros:
- Easy setup, allowing teams to quickly implement the tool.
- Instant usability, making it accessible for product teams without extensive training.
- Cons:
- Limited depth in analytics, especially in lower-tier plans.
- Slow user interface can hinder the user experience.
- Key features, such as advanced funnel analysis and in-depth heatmap reports, are locked behind paywalls, limiting functionality for cost-conscious teams.
In conclusion, while Smartlook offers valuable features for mobile app product teams, its limitations in pricing and depth may require careful consideration.
Best for Enterprises: Fullstory
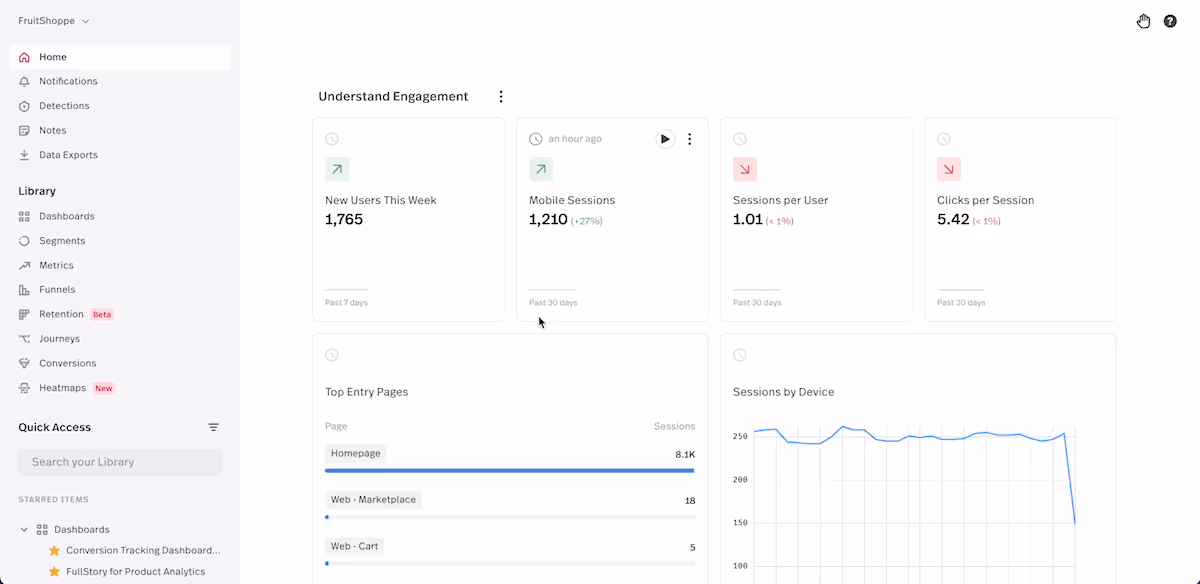
Best for
Fullstory is an analytics platform designed for enterprises seeking deep insights across large product portfolios. Its primary audience includes businesses that require a comprehensive understanding of user interactions on their websites. This software excels in offering detailed analytics, making it a valuable tool for organizations looking to optimize their digital experiences.
G2 Ratings
With a G2 score of 4.5/5, Fullstory is recognized for its depth of features and robust capabilities. Users appreciate its ability to provide granular insights, but common complaints highlight issues with high costs and complex contract structures, which may deter potential users looking for straightforward solutions.
Key Features
- Session Replays: Allows users to watch how website visitors interact with their sites, facilitating a better understanding of user behavior and pain points.
- Heatmaps: Visual representations of user interactions that help identify which areas of a webpage attract attention. This feature is crucial for optimizing website layouts.
- Advanced Behavioral Analytics: Provides in-depth analysis of user actions, enabling businesses to make data-driven decisions for improved user engagement.
Pricing Information
- While Fullstory does not publicly disclose its pricing
- Starting at a significantly higher price point than other tools
- A free trial is available to explore its capabilities before committing.
Pros and Cons
- Pros: Fullstory is a polished, enterprise-ready platform that delivers sophisticated analytics and insights.
- Cons: The opaque pricing model can be frustrating, and slow onboarding processes may hinder adoption. Additionally, this tool is not well-suited for small businesses due to its cost and complexity.
In summary, while Fullstory offers substantial features for website optimization and user behavior analysis, its high price point and intricate contracts may pose challenges for enterprises.
Best for UX Teams in the eCommerce: Lucky Orange
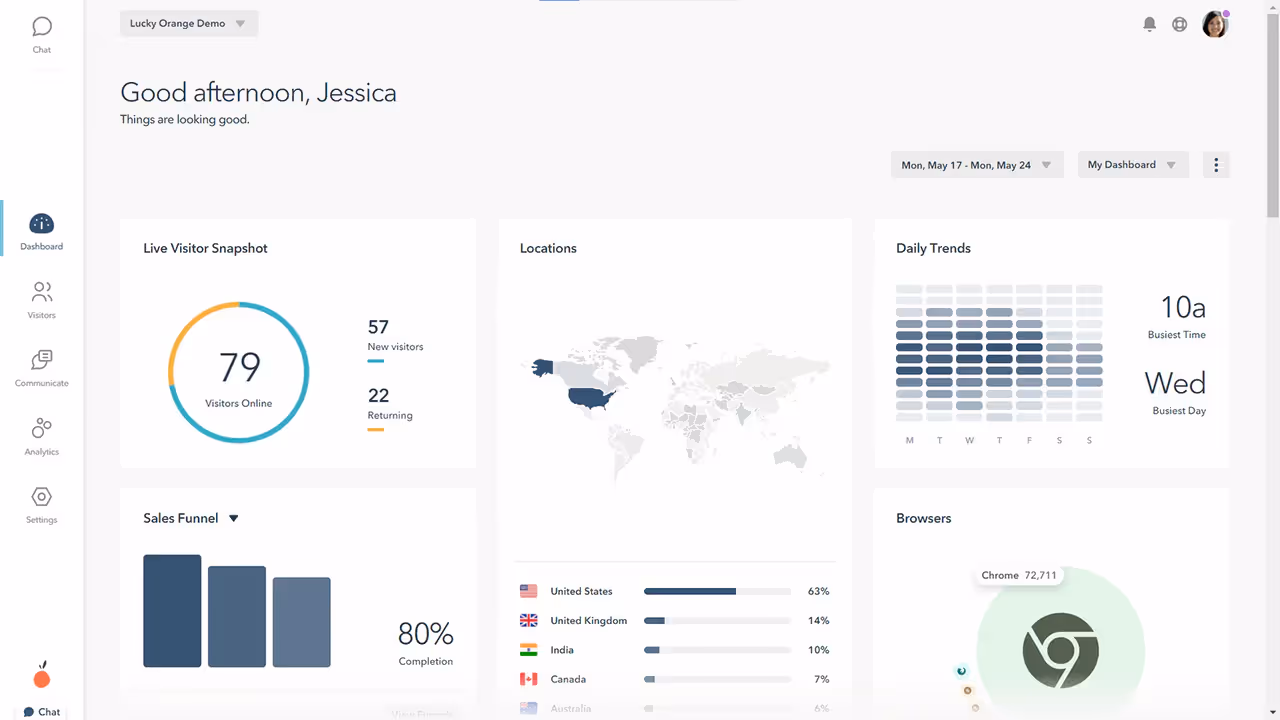
Best for
Lucky Orange is a robust behavior analytics tool that specializes in providing UX teams in the eCommerce sector with essential insights into user interactions. This software is particularly useful for teams looking to enhance their websites or mobile apps by understanding customer behavior through various heatmap types and session replay capabilities.
G2 Ratings
With a G2 rating of 4.6/5, Lucky Orange is generally well-received; however, users frequently report issues related to video loading and data inaccuracies, which can hinder the overall effectiveness of the platform.
Key Features
- Dynamic Heatmaps: This feature offers a comprehensive view of user clicks and movement, allowing for informed design decisions.
- Recordings: Session replay tools enable UX teams to observe real user sessions, revealing pain points and areas for improvement.
- Live Chat: Facilitates real-time communication with visitors, enhancing customer engagement and support.
- Funnels: Visual representation of user journeys helps identify drop-off points, allowing for targeted optimization.
- Custom Surveys: Collects direct feedback from users, providing qualitative data that complements quantitative insights.
Pricing Information
- Lucky Orange includes a free trial
- Starting at $39 per month
- Allows teams to evaluate its core heatmap software functionality before committing.
Pros and Cons
- Pros: As an all-in-one CRO toolkit, Lucky Orange provides a real-time solution for user behavior analytics, streamlining the optimization process.
- Cons: However, the platform suffers from data precision issues and may overwhelm users with its extensive features, making it less ideal for teams seeking simplicity.
Best for Free Heatmaps: Microsoft Clarity
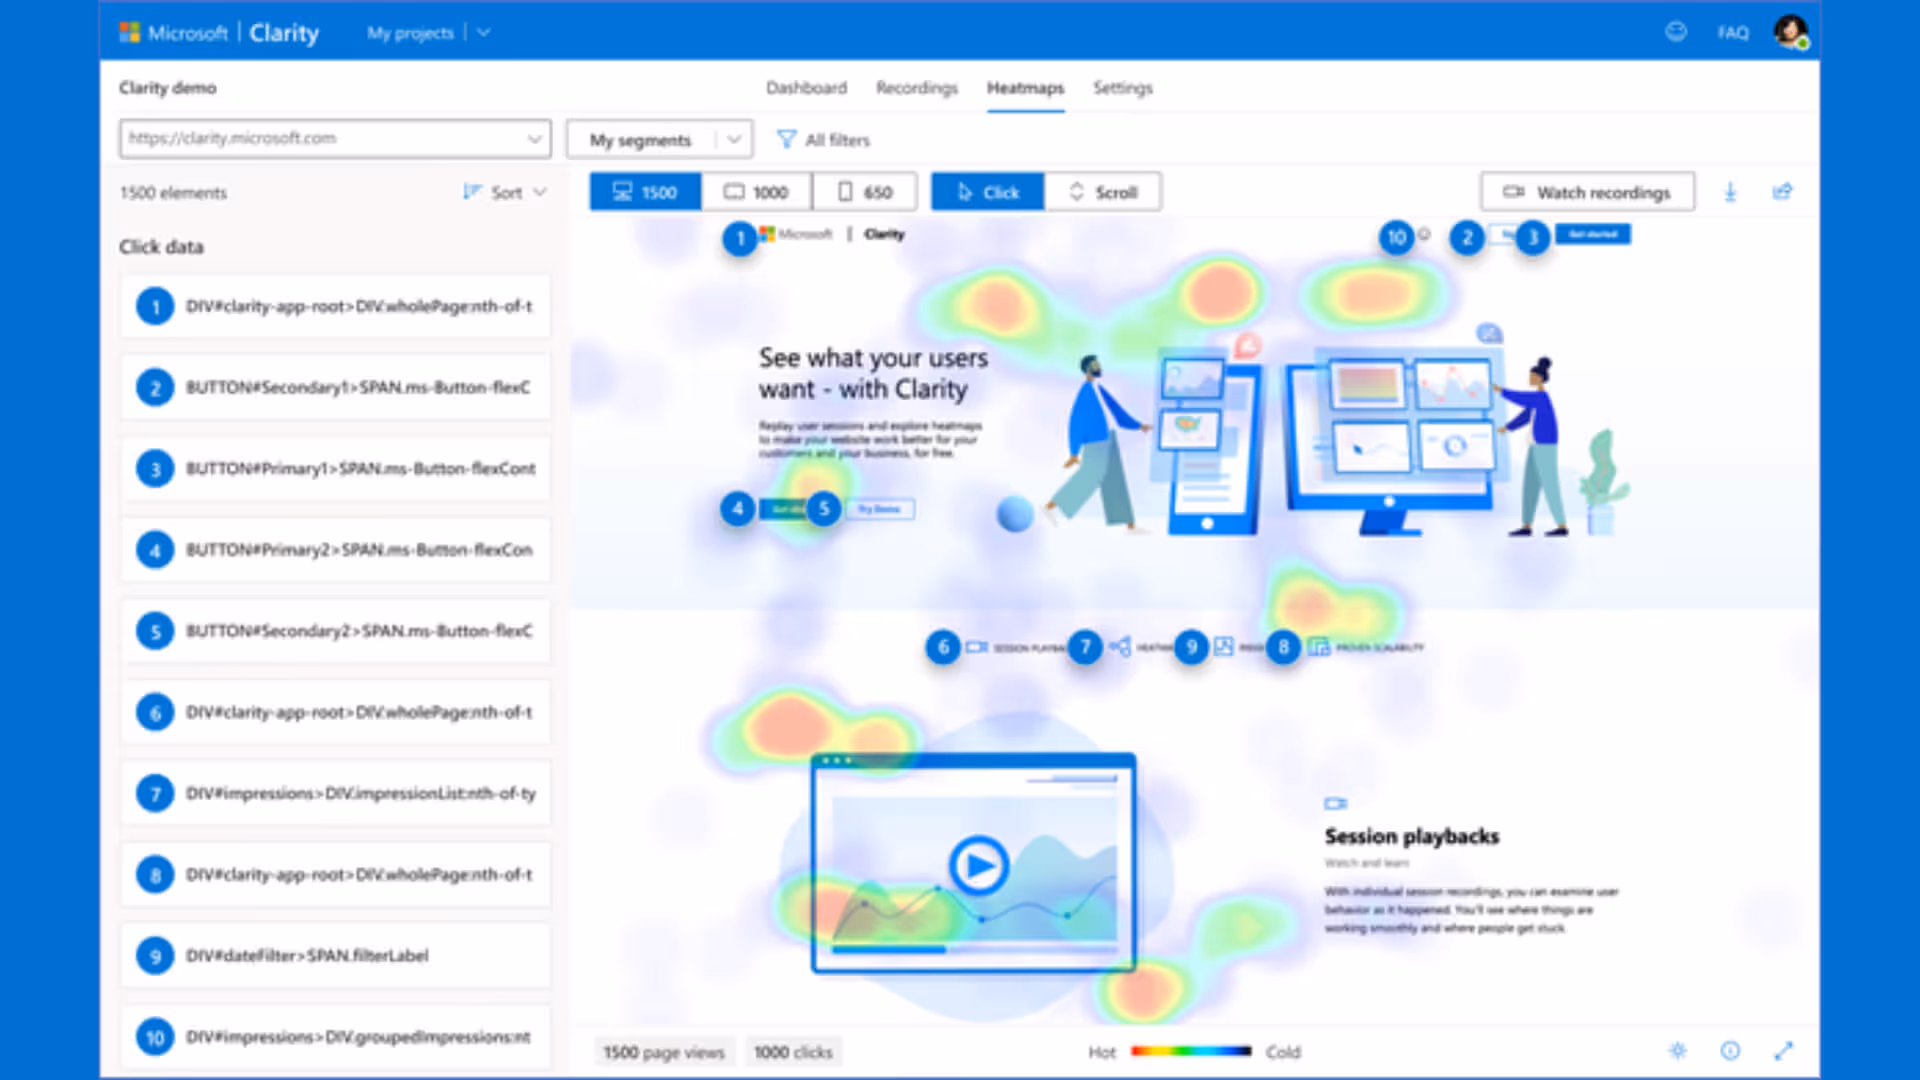
Best for
Microsoft Clarity is a free heatmap software tool designed for budget-tight teams seeking basic form analytics and user behavior insights. Its typical audience includes small businesses and startups aiming to improve website or mobile app performance without incurring costs.
G2 Ratings
Microsoft Clarity maintains a respectable G2 rating of 4.5/5. Users appreciate the value of its free offering and ease of use. However, some mention that its analytics are not as robust as paid competitors, and advanced users may find the insights too surface-level.
Key Features
- Session Recordings: Watch how users interact with your site to uncover issues or patterns in real-time.
- Heatmaps: Track clicks and scrolls to understand which parts of your site get the most engagement.
- Rage Click Detection: Automatically flags areas of frustration where users repeatedly click.
- Dashboard Insights: Simple interface that highlights key behavioral trends without overwhelming users.
Pricing Information Microsoft Clarity is completely free to use, making it a no-brainer for teams just starting out or operating on a tight budget.
- Starting at $0 per month
Pros and Cons Pros:
- 100% free forever, no hidden charges.
- Easy to set up and integrates with minimal effort.
- Lightweight and intuitive UI for quick insights.
Cons:
- Lacks deeper analytics or segmentation features.
- No advanced customization or dashboards.
- Not ideal for larger teams or complex tracking needs.
In short, Microsoft Clarity is a strong contender for free heatmap tools, especially for beginners or small teams looking to get started with user behavior tracking.
Best for Revenue Attribution to eCommerce Sites UI/UX: Heatmap.com
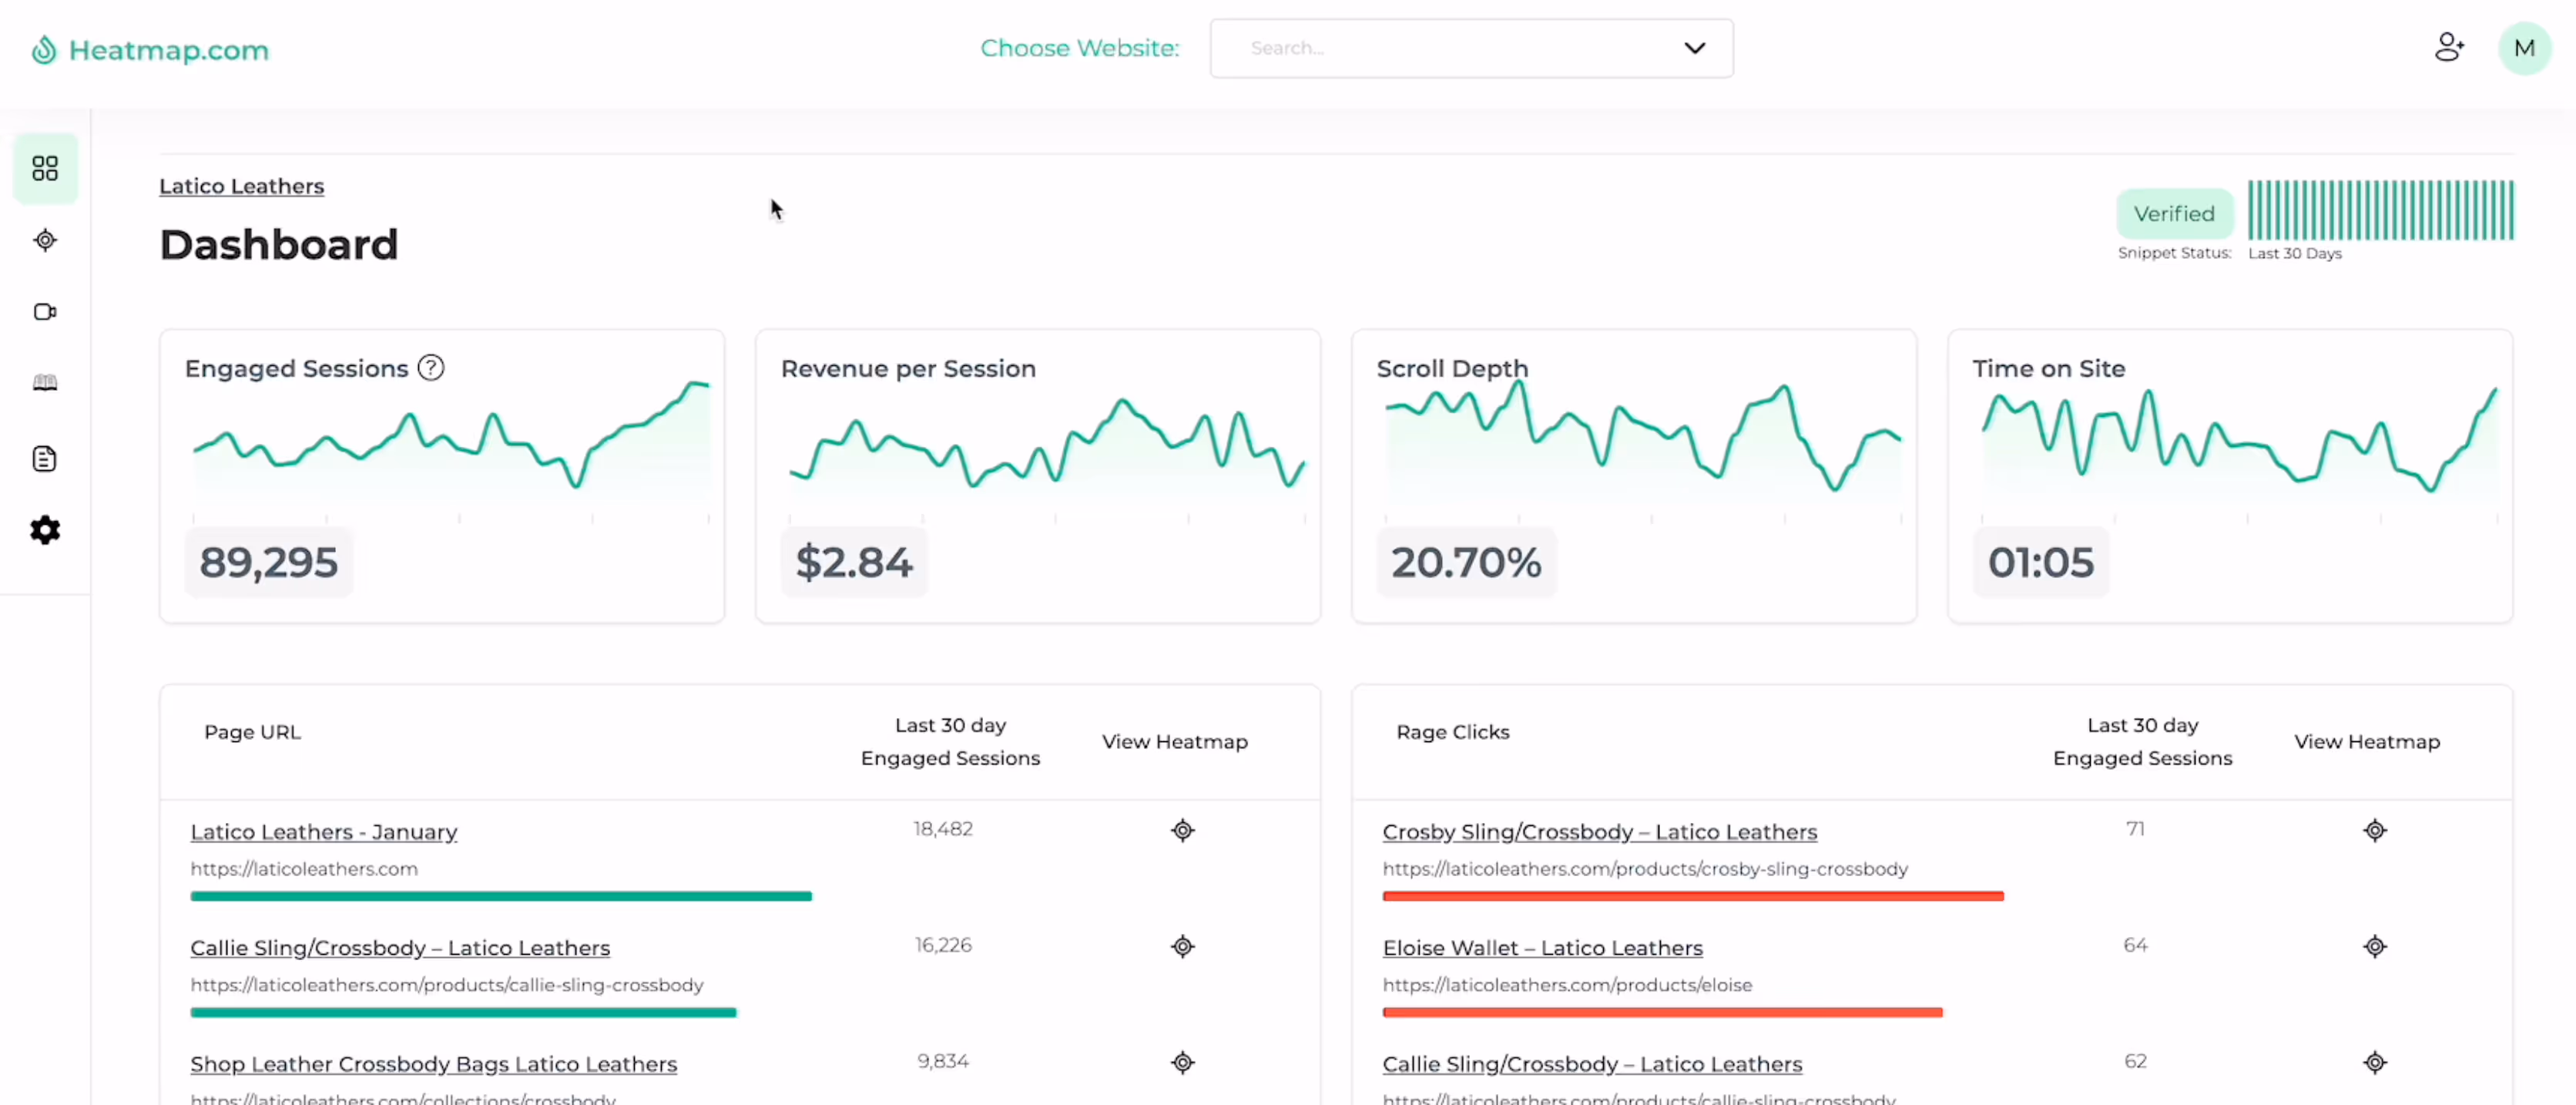
Best for
heatmap.com is built for eCommerce teams that want to connect the dots between user behavior and actual revenue. It shines when you're not just looking for “where users click,” but why they buy—or bounce. Its ideal users are growth-minded eCom brands that geek out over behavioral data tied directly to the checkout funnel.
G2 Ratings
With a G2 rating of 3.5/5, heatmap.com gets points for its focus on revenue insights, but users aren’t shy about pointing out the rough edges—especially when it comes to dynamic websites, privacy setups, and a not-so-plug-and-play integration process.
Key Features
- Revenue Heatmaps – Visual overlays that tie user clicks and scrolls directly to dollar outcomes.
- Session Replays – Capture and replay real user sessions to understand behavior pre-purchase or pre-abandon.
- Scroll Maps – Visualize how far users scroll on your product pages to optimize content placement.
- AI Insights – Machine-learned suggestions that highlight conversion bottlenecks.
- eCommerce Integrations – Built with online stores in mind; syncs with platforms like Shopify or WooCommerce to trace behavior across carts, funnels, and thank-you pages.
Pricing Information
heatmap.com starts at $117/month, with pricing influenced by revenue metrics rather than just session volume. A free plan exists, but it’s more of a teaser—missing key features like AI insights or in-depth revenue tracking.
Pros and Cons
Pros:
- Revenue-centric analytics = less guessing, more ROI clarity.
- AI-driven suggestions help you spot patterns humans might miss.
- Strong alignment with eCommerce platforms.
Cons:
- On the pricey side for early-stage or smaller shops.
- Can struggle with dynamic/reactive front-end frameworks.
- Users report occasional delays in data syncing and session rendering.
If you're in eCommerce and want analytics that speak in dollars, not just clicks, heatmap.com might be worth the price tag—just expect a bit of a learning curve.
Related articles

Get Started for Free
Join thousands of product people, building products with a sleek combination of qualitative and quantitative data.