
Product Stickiness: What It Is, Why it Matters, and How to Improve it

Even after signing up, most products struggle to hold users. Across digital products, about 70% of users churn within three months, meaning they stop returning soon after initial use; a leak that’s often invisible until it’s too late to fix.
One of the simplest ways to quantify how often people come back is the DAU/MAU ratio, which is the percentage of monthly active users who engage daily. In SaaS products this benchmark tends to sit around 13% on average, with truly sticky products reaching 20% or more.
These numbers aren’t academic benchmarks. They show a hard truth: most tools aren’t yet part of users’ routines, and poor stickiness directly signals weak retention and lower long-term value. In this article, we unpack what stickiness really measures, why it matters for product health, and how to improve it with metrics and behavior data you can act on.
What you’ll learn
- How to recognize real product stickiness in user behavior — beyond surface engagement and vanity metrics
- Which metrics and patterns reliably show whether users return by habit or drift away over time
- How to use session data and journeys to explain why stickiness improves or breaks
- What product teams can change to improve stickiness without chasing activity or adding unnecessary features
What is product stickiness?
Product stickiness is a measure of how often users return to and interact with a product over time. It reflects the frequency and consistency of usage rather than a one-off visit; often quantified by the DAU/MAU ratio (Daily Active Users divided by Monthly Active Users).
How stickiness differs from engagement, retention, and usage
- Engagement describes how users interact with a product (e.g., clicks, feature use). Stickiness focuses on how often they come back.
- Retention measures whether users stay with a product over time. Stickiness shows how frequently they return within that period.
- Usage counts actions or sessions. Stickiness adds a habit pattern layer by tracking repeat behavior.
What stickiness is not
- It’s not just time spent in a session or number of clicks; high time doesn’t guarantee repeated value.
- It’s not dependency or forced usage (e.g., notifications or reminders that artificially inflate activity).
- It’s not simply feature overload; more features don’t automatically drive repeat, meaningful use.
Why product stickiness matters
Product stickiness reveals real product value.
Fast growth can hide deep problems if users don’t actually return. Stickiness shows whether people keep using the product over time, not just open it once. Low stickiness often signals unseen or lost user value.
Stickiness is an early signal of product–market fit.
Products that become a regular part of a user’s workflow usually match real needs. When usage patterns stabilize and return rates rise, it often means the product is solving a problem users care about.
Stickiness impacts retention, expansion, and churn.
Sticky products reduce churn by keeping customers engaged longer. That means more renewals and higher lifetime value. They also make it easier to expand revenue with upgrades and additional features because users already spend time in the product.
Teams often overestimate engagement without behavior context.
Seeing clicks or logins doesn’t prove repeat value. Without understanding how often and why users return, teams can mistake superficial metrics for meaningful engagement (and miss the real retention risks).
How product stickiness shows up in user behavior
Product stickiness becomes visible in repeatable usage patterns, not in isolated sessions or spikes. You can spot it by watching how behavior changes over time.
Repeated return patterns
Sticky products see the same users come back often. Daily active users (DAU) reappear across many days within a month, not just once. When a large share of monthly active users (MAU) return frequently, it signals real user stickiness and stronger customer retention.
Example: A reporting tool where existing users open the product every weekday morning, even if sessions stay short.
Faster paths to value over time
Sticky users move faster. They need fewer clicks to reach outcomes that matter. Sessions become more direct, which shows growing perceived value and alignment with user needs.
Example: New users spend 8–10 minutes setting up a dashboard. After a few weeks, the same users complete the same task in under 2 minutes.
Consistent use of core features
Sticky users don’t use everything. They return to a small set of features tied to the core value proposition. Broad feature usage matters less than repeat feature adoption.
Example: In a SaaS analytics product, sticky users repeatedly use session replay and filters, while ignoring newer secondary features.
Reduced friction across sessions
As users become sticky, friction points fade. Errors drop. Navigation becomes predictable. Sessions feel smoother, even if they become shorter. This often precedes higher customer satisfaction according to sentiment analysis tools and increased long-term customer lifetime value.
Example: Support tickets decline for users who have reached stable usage patterns, even without new features added.
Does more engagement mean more stickiness?
High clicks, long sessions, or frequent logins don’t automatically mean users are sticky. Frequent usage without repeat value often hides confusion or forced behavior. Stickiness shows up when users return on their own and complete meaningful actions faster.
In short, product stickiness refers to how reliably users return and get value, not how busy sessions look. Watching these behavior patterns helps teams analyze product stickiness before churn shows up in revenue metrics.
How to measure product stickiness
Product stickiness becomes measurable when you look at how often users return and what they do when they come back. These signals work best together, not in isolation.
- DAU / WAU / MAU ratios. These ratios show how frequently users return within a given period. A higher DAU/MAU ratio means a larger share of monthly users engage daily, which signals stronger stickiness. A low ratio often means users show up occasionally, not habitually.
- Session frequency vs. session duration. Long sessions don’t always indicate value. Frequent, shorter sessions often signal stronger stickiness because users know where to go and what to do. Repetition matters more than time spent.
- Feature activation vs. passive usage. Visiting a page isn’t the same as using a feature. Stickiness shows up when users repeatedly trigger key actions tied to the product’s core value, not when they casually browse.
- Return cadence as a stickiness signal. Look at how regularly users come back: daily, weekly, or only once a month. Consistent return patterns usually predict higher retention better than one-time spikes in activity.
Taken together, these metrics help measure stickiness without guessing. They show whether users come back by habit, by need, or not at all.
Read more: How to improve user stickiness >>
Best practices for improving product stickiness
#1 Segment users before analyzing stickiness
Stickiness rarely behaves the same across an entire user base. When you analyze everyone together, strong signals from a small group of loyal customers often mask weak engagement elsewhere. Segmenting users helps you understand who actually returns, how often users engage, and where retention breaks down across the customer lifecycle.
Do
- Segment users based on behavior, not averages. Separate casual, core, and power users so stickiness metrics reflect real customer behavior instead of blended data from unique users with very different needs.
- Set different stickiness expectations per segment. Daily usage from power users and weekly usage from core users can both signal healthy user retention when measured against the right baseline.
- Use segmented data to guide decisions. Comparing stickiness rates across user segments creates actionable insights that help retain existing users and strengthen customer loyalty over time.
Don’t
- Don’t rely on “average users” or global ratios alone. Aggregate stickiness metrics often hide churn inside specific segments and distort the true customer retention rate.
- Don’t design for power users by default. Copying workflows from the most active users usually overwhelms casual users and weakens the broader user base.
- Don’t mix new users with long-term users. Blending onboarding behavior with mature usage skews product stickiness data and leads to poor, data-driven decisions.
#2 Focus on behaviors that signal real stickiness
Product stickiness becomes visible when you look past surface activity and focus on behaviors that reliably lead users back. A good starting point is data from returning users: actions that appear again and again before repeat sessions usually point to real value.
Some actions are sticky, others are just noise. For example, in a SaaS analytics tool, exporting a report or saving a custom view often precedes return usage. Clicking through filters without saving anything rarely does. Sticky actions move users closer to an outcome. Noisy actions inflate engagement without improving retention.
The same distinction applies to feature use versus outcome completion. Opening a feature doesn’t automatically mean value was delivered:
- In a collaboration tool, opening chat is less meaningful than sending messages in an active workspace.
- In a CRM, viewing contacts matters less than logging interactions or updating records.
Stickiness grows when users repeatedly complete outcomes that match the product’s core purpose.
Early activation events often signal whether users will return. Creating a first dashboard, publishing the first article, or completing the first setup flow frequently correlates with higher return rates. Users who reach these milestones tend to adopt the product as part of their routine, not just explore it once.
Finally, it’s important to separate intent from accidental interaction. A short session with no completed action often means a misclick or curiosity. A session where users navigate directly to a key feature and finish a task shows purpose. Weighting behaviors by intent helps filter out noise and keeps stickiness analysis focused on actions that actually matter.
Across products, the pattern stays consistent: behaviors that drive stickiness repeat, lead to clear outcomes, and become more efficient over time. That’s where real stickiness lives.
A good starting point is data from returning users: actions that appear again and again before repeat sessions usually point to real value. Product teams can also use tools like Rocket.new’s intelligence feature to turn recurring behavior patterns into clearer signals about what users actually value.
Use session recordings to explain the numbers
Imagine this scenario. Your metrics look stable. Monthly usage holds. Daily active users don’t drop. The stickiness ratio looks acceptable. Yet renewals slow down and fewer customers are retained. The numbers suggest stability, but the outcome tells a different story.
This is where metrics reach their limit. Product stickiness metrics show what is happening, not why. A DAU/MAU ratio or product stickiness calculation can confirm that users return less often, but it can’t explain what users experience inside the product.
Session recordings add that missing context. They turn user engagement data into visible behavior and help teams understand how customers actually interact with the product.
You start noticing patterns such as:
- users hesitating or pausing before key actions
- repeated clicks or loops in the same flow
- abandoned steps in otherwise common workflows
- short sessions with no completed outcomes
Over time, these signals form clear UX friction patterns. Sticky sessions usually look calm and direct. Users go straight to core features, complete tasks, and leave. Non-sticky sessions feel scattered, with more backtracking and unfinished actions.
Comparing sticky and non-sticky sessions side by side makes the gap obvious:
- sticky users move with intent and finish what they start
- non-sticky users explore but rarely progress
That contrast helps explain whether the product’s ability to retain customers comes from real value or surface-level engagement that fades. Session recordings don’t replace stickiness data — they explain it.
Read engagement intensity as patterns, not snapshots
Engagement intensity only becomes meaningful when you look at it over time. Single sessions or isolated spikes rarely explain whether users are forming a habit or just passing through.
What matters first is the balance between frequency and depth of use. Users who return often, even for short sessions, usually show stronger stickiness than users who spend a long time once and never come back. Repeated, purposeful visits signal that the product fits into a regular workflow.
Patterns also reveal early habit formation. Sticky users tend to engage on a predictable rhythm — daily, weekly, or around specific tasks. When usage follows the same cadence across many users, it often points to a product that supports real, repeat needs rather than occasional exploration.
Looking at engagement before and after product changes adds another layer. A new feature or UX update may increase activity for a short period, but only sustained patterns show whether it actually improved stickiness. Comparing behavior across time windows helps separate short-term curiosity from lasting value.
Some spikes look positive but aren’t. False engagement spikes often come from notifications, promotions, or forced flows. You’ll see activity jump briefly, then fall back to previous levels. Without pattern analysis, these spikes can be mistaken for progress when they don’t lead to better retention.
In practice, engagement intensity should be read as a story that unfolds over time. Patterns tell you whether users are building a habit — snapshots rarely do.
Map user journeys to improve stickiness at scale
Stickiness often breaks at the journey level, not inside a single session. When users drop out repeatedly at the same steps, the problem is usually structural. Mapping user journeys helps teams see where repeat usage stalls and which paths actually support retention.
Action checklist:
- Identify entry paths linked to retained users. Compare where long-term users start versus where one-time users enter. Entry points that correlate with higher retention often lead users faster to core value.
- Locate recurring drop-offs across journeys. Look for steps where many users leave or stall. Repeated drop-offs usually signal unclear expectations, missing guidance, or unnecessary friction.
- Build funnels to diagnose, not to optimize conversions. Use funnels to understand where users struggle, not to push them forward faster. Funnels work best as diagnostic tools, not performance targets.
- Compare journeys of sticky and non-sticky users. Lay successful paths next to failing ones. Small differences — an extra step, a confusing screen — often explain large gaps in repeat usage.
- Fix journey friction before adding new features. Journey improvements often deliver more stickiness than feature releases. Removing obstacles in existing flows usually increases repeat usage faster than expanding functionality.
At scale, journey mapping turns isolated insights into system-level fixes. When paths to value become clearer, stickiness improves across the user base; not just for a small group of power users. Mapping journeys at scale often requires embedded analytics tools that surface where repeat usage breaks down.
Apply principles that compound stickiness
Product stickiness grows through small, compounding improvements rather than one-off changes. The most reliable gains come from removing friction before introducing anything new. If users struggle to complete existing workflows, additional features only add cognitive load and slow adoption.
Strong stickiness also depends on optimizing for outcomes instead of activity. Clicks, page views, or long sessions can look healthy while masking weak value delivery. When users repeatedly achieve the result they came for (faster, with fewer steps) return behavior follows naturally.
Early experiences matter more than later polish. Value loops should reinforce themselves as soon as possible, especially for new users. When people reach a meaningful outcome early, they are far more likely to return and build a habit around the product.
Finally, simpler paths almost always outperform broader choices. Expanding options rarely improves stickiness if it increases hesitation or confusion. Clear, focused journeys help users act with confidence, repeat successful behaviors, and integrate the product into their routine over time.
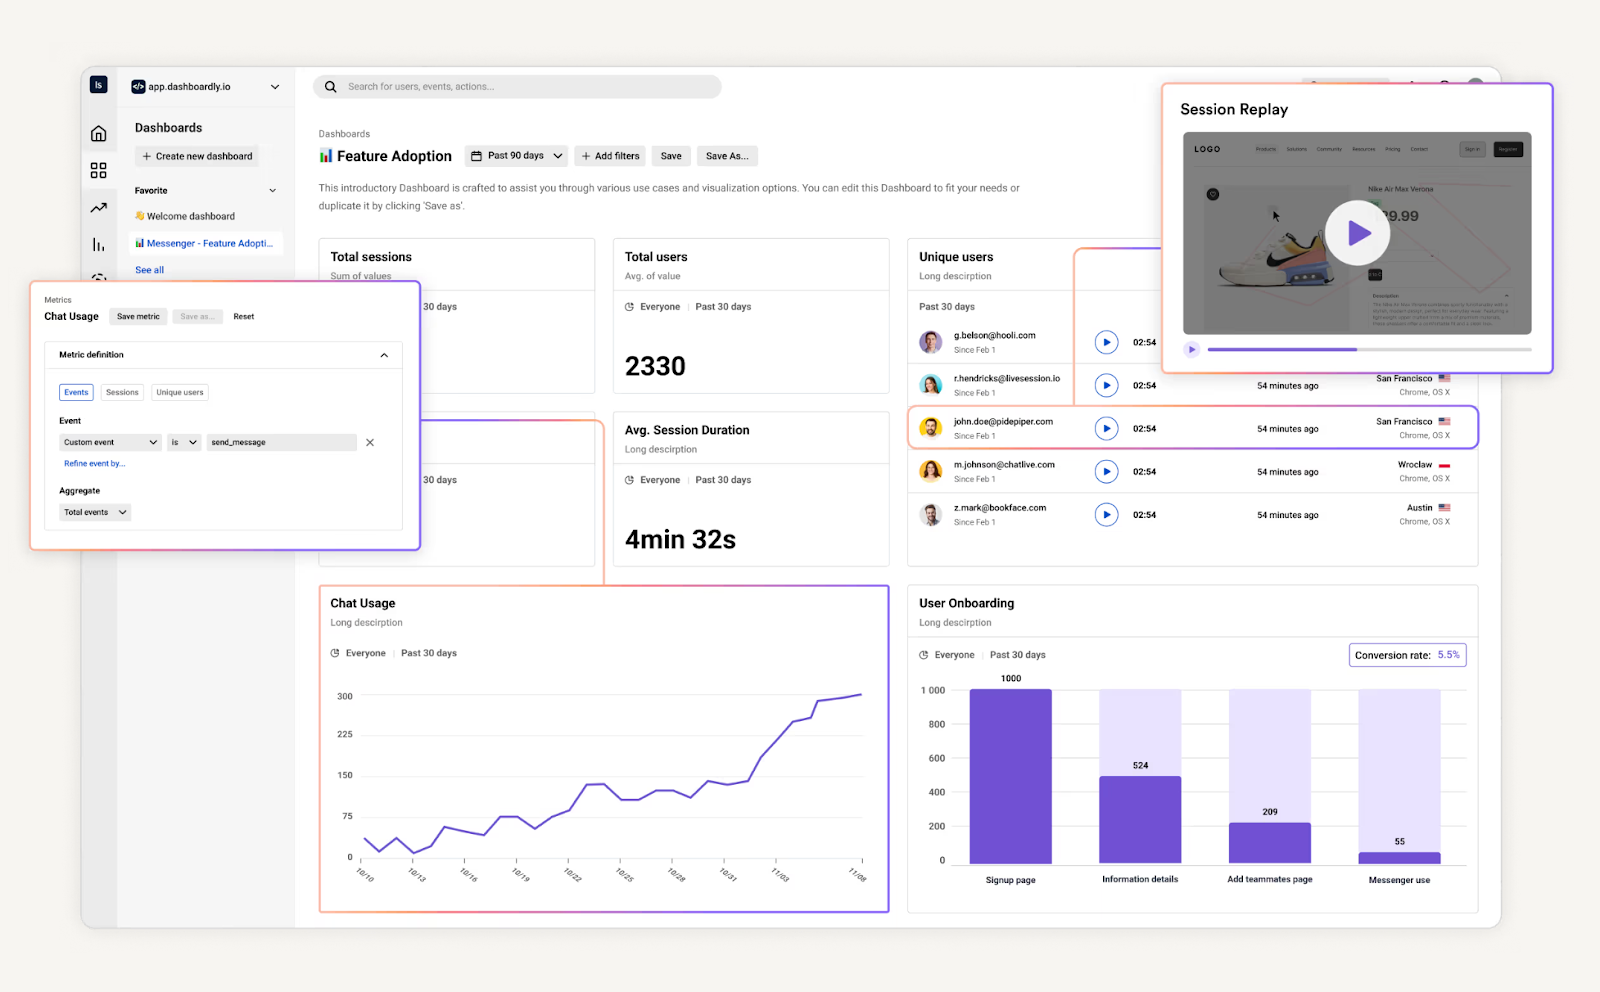
How LiveSession supports stickiness analysis
Product stickiness is easier to understand when numbers and behavior live in the same place. LiveSession brings usage metrics and real user sessions together, which helps teams see not just what users do, but how they move through the product while doing it.
Instead of treating dashboards and recordings as separate views, LiveSession connects them. You can look at stickiness-related metrics – such as feature usage, return frequency, or funnel progression – and then open the exact sessions behind those numbers. That context makes it easier to explain why certain users return regularly while others drop off.
This combination helps teams move from surface signals to real causes. A dip in stickiness might trace back to a confusing step, an unexpected dead end, or a workflow that takes longer than it should. Session replays and journey views add clarity to metrics that would otherwise stay abstract.
Because both metrics and behavior update continuously, LiveSession also supports an iterative way of working. Teams can observe patterns, make changes, and then quickly check whether user behavior actually shifts. Over time, this creates a tighter feedback loop between product decisions and how users experience the product in practice.
Stickiness is a product outcome, not a metric to game
Product stickiness works best as feedback, not as a vanity KPI to optimize in isolation. When frequent users engage and a product’s daily active users return by habit, the metric reflects real value. When numbers rise only because of reminders, forced flows, or surface activity, stickiness loses meaning. The signal matters more than the score.
Retention compounds faster than acquisition because it builds on what already works. Keeping customers retained creates a stronger base for growth than constantly chasing new customers who may never return. Small improvements in repeat usage often outperform large acquisition efforts, especially once the product fits into a regular workflow.
Viewed this way, stickiness isn’t a target to push upward. It’s an outcome that follows from clear value, low friction, and consistent user behavior. Teams that focus on understanding why users come back — not just how often — end up with stickier products and healthier growth over time.
FAQ
What is product stickiness?
Product stickiness describes how often users return and engage with a product over time. It reflects whether the product becomes part of a routine for loyal customers, not just a one-time visit. In the SaaS industry, stickiness is a key component of building a loyal customer base because it shows sustained value beyond initial adoption.
How do you measure product stickiness?
Teams typically calculate product stickiness using return frequency metrics. The most common approach is a product stickiness formula based on DAU/MAU (Daily Active Users divided by Monthly Active Users). This shows how many users come back regularly compared to how many show up in a month. Segmenting by user demographics or lifecycle stage helps avoid misleading averages.
What’s a good DAU/MAU ratio?
There’s no single “good” number, but many SaaS companies see ratios between 10–20%. Higher ratios indicate that users engage frequently and that more customers are retained over time. The right benchmark depends on how often users realistically need the product and how many users you expect to engage daily.
How do session recordings help improve stickiness?
Session recordings add context to stickiness metrics. They show why users return or leave by revealing friction, confusion, or smooth workflows. Combined with user feedback and customer feedback, recordings help teams understand which behaviors encourage users to return, complete tasks, or make repeat purchases — all of which help boost retention and support long-term growth.
Related articles


Get Started for Free
Join thousands of product people, building products with a sleek combination of qualitative and quantitative data.