
Funnel Optimization: Definitions, Metrics, and Fixes That Work

Funnel optimization is the stage-by-stage, data-driven work of finding where prospects drop out of your conversion path and fixing the biggest leaks first, so you extract more revenue from the traffic you already have instead of just buying more of it. That’s the whole idea in one sentence. Everything else is execution.
The primary objective isn’t more visitors. It’s plugging the leaks that already cost you the most conversions among people who showed up.
Three metrics matter more than the rest when you start:
-
Stage-to-stage conversion rate — the percentage of people who move from one step to the next
-
Drop-off rate — the inverse: how many disappear at each transition
-
Time-in-stage — how long people linger before converting or bouncing, which often signals confusion or friction
In B2B specifically, buyers complete roughly 70% of their research before ever talking to a vendor, and trial-to-paid conversion rates commonly land between 8% and 25% depending on product complexity and onboarding quality. Those numbers are your starting benchmarks, not your ceiling.
Key Takeaways
Funnel optimization works because it prioritizes the transition losing the most volume, not the page that’s easiest to edit.
| Point | Details |
|---|---|
| Define stages first | Agree on a stage model (AIDA, TOFU/MOFU/BOFU, or Awareness→Retention) before instrumenting events. |
| Track three core metrics | Watch stage-to-stage conversion, drop-off rate, and time-in-stage at every transition. |
| Prioritize by impact | Score leaks as upstream volume times drop-off, then rank by impact, confidence, and ease. |
| Segment before you diagnose | Break funnels down by device, channel, and cohort since blended averages hide broken segments. |
| Pair charts with session replay | Livesession connects funnel data to session recordings so teams see the behavior behind each leak, not just the number. |
Table of Contents
-
How Does Funnel Work Fit Into Broader Marketing and Sales Strategy?
-
Practitioner Perspective: The One Habit That Changes Outcomes
What Is Funnel Optimization, Exactly?
Funnel optimization is the practice of mapping every step a prospect takes from first touch to conversion (and often beyond, into retention) and systematically improving the transitions where the most people quit. It’s a macro discipline. You’re looking at the whole journey, not a single page.
That’s the key distinction from conversion rate optimization, and it trips people up constantly. CRO typically zooms in on a single page or form: button color, headline copy, field count. Funnel optimization zooms out. It asks which stage is bleeding the most value, then decides whether the fix is a page change, an email sequence, a pricing tweak, or a product onboarding flow. CRO is a tool funnel optimization uses. It isn’t the same job.
Most teams use one of three stage models:
-
AIDA (Attention, Interest, Desire, Action) — the classic advertising framework
-
TOFU/MOFU/BOFU (top, middle, bottom of funnel) — the marketing-ops shorthand
-
Awareness → Consideration → Conversion → Retention — the version that acknowledges the funnel doesn’t end at checkout
Pick one and standardize on it across marketing and product, because half the friction in funnel work is teams arguing over what “middle of funnel” even means. The label matters less than everyone agreeing on it.
How Do You Map and Measure a Funnel?
You can’t optimize what you haven’t defined. Before touching a single landing page, get the instrumentation right, because a beautifully redesigned page tested against broken tracking teaches you nothing.
-
Define your funnel steps explicitly. Write down the entry event, every intermediate step, and the exit (conversion) event. “Someone lands on the pricing page” and “someone starts checkout” are different events and need different names in your tracking.
-
Instrument events with naming discipline. A
signup_startedevent that means three different things across three team’s dashboards will quietly poison your analysis for months. Agree on a taxonomy before you ship tracking code, not after. -
Calculate stage-to-stage conversion and drop-off for each transition, not just the top-line rate from first touch to purchase. A funnel that converts 3% overall could be hiding a stage that converts at 90% right next to a stage that converts at 12%.
-
Track time-in-stage alongside conversion rate. A step people rush through and a step people abandon after five minutes of hesitation look identical in a simple conversion percentage but need completely different fixes.
-
Segment the data by device, acquisition channel, cohort (signup month, plan tier), and new versus returning visitor. This is where most of the real findings live.
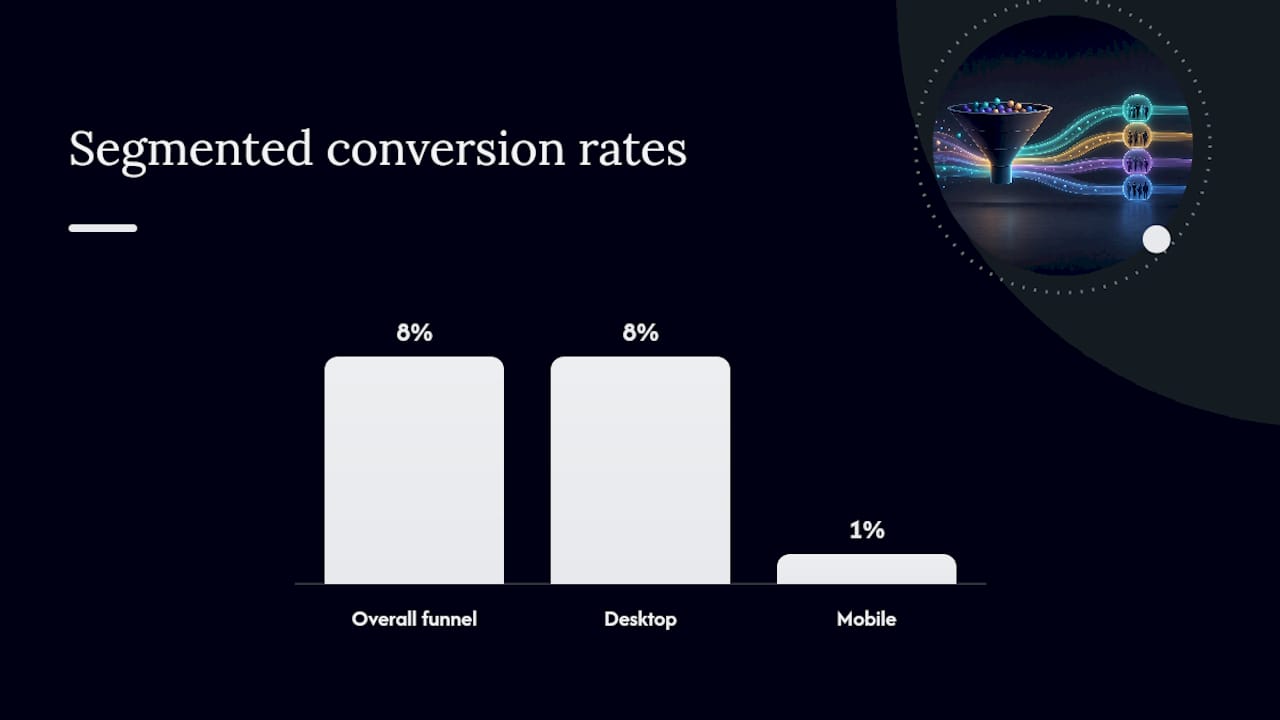
Segmentation is the step teams skip when they’re in a hurry, and it’s usually the one that matters most. A funnel that converts at a healthy 8% overall can be masking desktop converting at 8% while mobile limps along at 1%. Average that blended number and you’ll never find the mobile problem, let alone fix it.
Pro Tip: Before you segment by anything else, segment by new versus returning visitors. Returning users navigate faster and forgive more friction; treating them the same as first-time visitors in your funnel chart hides both a mobile bug and a genuinely great first impression at once.
How Do You Prioritize Which Leak To Fix First?
Not every drop-off deserves your next sprint. The math that separates a real prioritization framework from guesswork is simple: impact equals upstream volume multiplied by the drop-off rate at that stage.
A step near the top of your funnel with a mediocre drop-off rate often outranks a dramatic-looking drop further down, because more people are flowing through it.
Early-stage fixes also compound. Improve the top-of-funnel conversion rate and every downstream stage inherits more volume for free, which is why teams that treat funnel work as a continuous loop, measuring, testing, and keeping what works tend to see gains stack rather than plateau.
Once you’ve found the candidates, score them:
-
Impact — how much volume and drop-off does this stage represent?
-
Confidence — how strong is the evidence this is actually the problem?
-
Ease — how fast and cheap is the fix to build and ship?
That’s an ICE score, and it works because it forces you to weigh the exciting-but-risky fix against the boring-but-certain one honestly.
A fast prioritization checklist for your next planning session:
-
Pull the full funnel chart and rank stages by absolute lost volume, not percentage
-
Segment the top three leaks by device and channel to confirm they’re not artifacts
-
Score each candidate fix on impact, confidence, and ease
-
Commit to the top one or two, not five at once
Fixing five things simultaneously means you’ll never know which one actually worked.
What Tactics Fix Each Stage of the Funnel?
Different stages need different tools. Running a pricing-page experiment on a top-of-funnel awareness problem wastes a sprint. Here’s what actually maps to each stage.
Top of funnel: message match and relevance. The single highest-leverage TOFU fix is making sure the promise in your ad, email, or search snippet matches what the landing page actually says. Misalignment here doesn’t look like a “bad landing page” in your analytics. It looks like a high bounce rate with no obvious cause. Building out clear user personas before you write copy keeps targeting and message tight enough that the traffic arriving is actually the traffic you’re optimizing for.
Middle of funnel: earn trust before you ask for commitment. This is where progressive profiling (asking for an email before you ask for a phone number and company size) usually outperforms one long form. Content gating, case studies, and social proof placed right before a conversion point all reduce the “is this legitimate” hesitation that shows up as long time-in-stage numbers. In-flow education, a short explainer video or tooltip at the exact moment someone hesitates, often beats a generic FAQ page because it appears where the friction actually is.

Bottom of funnel: remove friction, not persuasion. By BOFU, people are already convinced. What kills conversions here is friction: unclear pricing, a checkout that demands account creation before payment, or a CTA button that isn’t obviously the next step. Trust elements (security badges, refund policy, customer logos) do more work here than anywhere else in the funnel, because the buyer is actively looking for a reason to hesitate.
Activation and retention: shrink time-to-value. For SaaS specifically, the funnel doesn’t end at signup. It ends when someone experiences the value they signed up for. Onboarding flows that get a new user to their first meaningful result fast, and trial nudges that re-engage someone who stalled, are where activation metrics live or die.
Pro Tip: If your trial conversion sits below the 8 to 25 percent range typical for B2B software, check time-to-value before you touch pricing. A trial that expires before someone reaches their “aha” moment will underperform no matter how good your pricing page looks.
How Do You Test Funnel Fixes Without Fooling Yourself?
A hunch that a fix worked isn’t the same as proof it worked, and this is where most funnel programs quietly go wrong.
-
Write the hypothesis before you build anything. “Changing the checkout CTA from ‘Submit’ to ‘Complete Purchase’ will increase checkout completion by reducing perceived commitment” is testable. “Let’s make checkout better” is not.
-
Pick one primary metric and calculate your minimum detectable effect (MDE) before launch. If your current conversion is 4% and you need to detect a move to 4.3%, you need meaningfully more traffic than if you’re trying to detect a jump to 6%.
-
Set run-length in advance and do not peek early. Checking results daily and stopping the moment you see a good number inflates false positives badly enough to invalidate the test. Account for weekly seasonality too. A Tuesday-only read will mislead you.
-
Use holdout groups for anything with delayed effects, like onboarding changes that might affect 30-day retention rather than day-one conversion. A same-day A/B split won’t catch that.
-
Segment your results before declaring a winner. A change that lifts desktop conversion but tanks mobile isn’t a win; it’s a trade you didn’t notice you were making.
Pro Tip: Guardrail metrics matter as much as your primary metric. If a checkout redesign raises completion rate but quietly increases refund requests thirty days later, you didn’t fix the funnel. You moved the friction downstream where it’s harder to see.
How Does Session Replay Turn Funnel Data Into Fixes?
A funnel chart tells you where people drop off. It almost never tells you why, and that gap is where most optimization programs stall out for weeks.
This is the piece combining quantitative funnel metrics with qualitative investigation is built to solve. A workflow that actually works looks like this:
-
The funnel chart flags a 40% drop between “form started” and “form submitted”
-
Session replay footage of that exact segment shows users repeatedly clicking a field that looks clickable but isn’t
-
Heatmaps confirm the pattern is widespread, not one confused user
-
A developer fixes the field in an afternoon instead of guessing at redesigns for two sprints
Session-level tools like Livesession pair replay and heatmaps directly with conversion funnels and error tracking, so the “where” and the “why” live in the same dashboard instead of two disconnected tools you have to mentally stitch together.
The chart tells you a stage is broken. The recording tells you which button, which field, or which confusing sentence broke it. Skip the second part and you’re optimizing blind.
Handle this carefully: session-level data is personal data under GDPR and CCPA, so masking sensitive fields (payment details, health information, anything a user typed that shouldn’t be recorded) isn’t optional. Any platform doing this well builds masking and consent controls in by default, not as an afterthought you configure after a complaint.
Which Tools Actually Support Funnel Optimization?
You need three categories of tooling, and most teams are missing at least one.
Analytics and funnel visualization tools chart your stage-to-stage conversion and drop-off automatically, so you’re not exporting spreadsheets every Monday. This is table stakes; without it you’re optimizing on gut feel.
Session replay and heatmaps answer the “why” question analytics can’t. A conversion funnel tells you 40% of people abandon a form. It won’t tell you they’re all getting stuck on the same confusing date field. That’s a behavioral question, and it needs behavioral evidence, not another dashboard number.
Experimentation platforms handle the actual A/B testing, sample-size calculations, and guardrail-metric monitoring so you’re not manually tracking statistical significance in a spreadsheet and guessing when to call a test.
A practical stack for most product and marketing teams pairs a funnel and session-analytics platform, something like Livesession, which bundles conversion funnels, heatmaps, session replay, and error tracking under one roof, with a dedicated experimentation tool for the testing layer itself. The two overlap less than they seem to. One tells you where the leak is and shows you the behavior behind it; the other proves whether your fix actually closed it.
Integration matters more than feature count here. A tool that connects to your existing stack, Intercom for support context, Segment for event routing, Shopify for ecommerce data, saves you from rebuilding your data pipeline every time you add a new analytics layer.
What Do Real Funnel Fixes Look Like in Practice?
Funnel optimization sounds abstract until you see the pattern of a real fix, and the pattern repeats more than people expect.
A SaaS company notices trial-to-paid conversion sitting at the low end of the typical range. The funnel chart shows the drop isn’t at checkout. It’s between account creation and first meaningful action inside the product, the activation step. Session replay reveals users landing on an empty dashboard with no clear next step. The fix isn’t a pricing change or a new landing page. It’s a guided first-action prompt that shows up the moment someone signs in with nothing set up yet. Trial conversion moves because time-to-value dropped, not because anything about the offer changed.
A different pattern shows up constantly in ecommerce: a healthy blended conversion rate masking a mobile checkout that’s quietly broken. Segmented funnel analysis is what surfaces this, because the blended number never would. Once isolated, the fix is often small: a payment field that doesn’t trigger the right mobile keyboard or a CTA button sitting below the fold on smaller screens.
The pattern across both: the fix that mattered wasn’t visible from the top-line conversion number. It only showed up once someone segmented the data and then went looking for the behavioral cause behind the segment that was underperforming. That two-step habit, segment first, investigate second, is the difference between a funnel optimization program that compounds and one that stalls after the first obvious win.
What Mistakes Derail Most Funnel Optimization Efforts?
The most common failure isn’t a bad fix. It’s fixing the wrong thing confidently.
Optimizing the visible page instead of the biggest leak tops the list. Marketing teams gravitate toward the landing page because it’s theirs to edit, even when the real leak is three steps downstream in a product flow nobody on the marketing team can touch. This is exactly why impact-first prioritization, ranked by volume times drop-off, has to override whoever has the easiest access to make a change.
Treating a blended metric as the truth. A 6% conversion rate that’s actually 9% on desktop and 1% on mobile will send you chasing the wrong hypothesis every time, because you’re solving for an average that doesn’t describe any real user.
Calling a test early. Peeking at results and stopping the moment the number looks good is the single fastest way to ship a change that does nothing, or actively hurts, once full-scale traffic hits it.
Ignoring that funnels loop, not flow. Modern buyers don’t move in a straight line; they research, leave, come back through a different channel, and re-enter at a different stage. A funnel model that assumes strict linearity will misattribute conversions to the wrong touchpoint and send you optimizing the wrong entry point entirely.
Fixing five things at once. When conversion improves after a sprint that touched the headline, the CTA, the form length, and the pricing table simultaneously, you’ve bought yourself a win with no idea which change earned it. The next quarter, you can’t repeat what worked because you never isolated it.
How Does Funnel Work Fit Into Broader Marketing and Sales Strategy?
Funnel optimization isn’t a side project for one analyst. It’s the layer that connects what marketing promises, what product delivers, and what sales closes.
Marketing owns the top of the funnel, but the message-match problem, an ad promising one thing and a landing page delivering another, is only visible once someone is tracking the transition between the two, not just the raw click-through rate. That visibility is a funnel-optimization function even when marketing owns the fix. Multi-channel funnels that combine paid, organic, and content touchpoints extract more value from traffic that’s already arriving, rather than pushing spend toward acquiring more of it, which is the same impact-first logic that drives stage prioritization.
Sales inherits whatever the funnel hands off, and a poorly optimized MOFU stage shows up as sales complaining about “unqualified leads” when the real problem is a content-gating step that let anyone through regardless of fit. Product, meanwhile, owns activation and retention, the stages that decide whether a conversion sticks or churns out within a billing cycle.
None of these teams can fix their piece without visibility into the others’ stages. A shared funnel chart, reviewed by marketing, sales, and product together rather than siloed into three separate dashboards, is what actually makes the “biggest leak first” prioritization possible across an entire go-to-market motion instead of just within one team’s slice of it.
Practitioner Perspective: The One Habit That Changes Outcomes
Most teams don’t fail at funnel optimization because they lack tools. They fail because nobody owns a recurring, disciplined look at the whole chart. Marketing checks its channel numbers. Product checks activation. Nobody sits down weekly and asks, “Where’s the single biggest leak right now, and who’s fixing it?”
Adopt a thirty-minute weekly leak review with marketing and product in the same room, looking at the same segmented funnel chart. Rank the top three drop-offs by volume, not by whichever team is loudest. Commit to one fix. Ship it. Repeat. The habit matters more than the framework.
Ready to See Your Funnel Leaks Firsthand?
Reading a funnel chart tells you something’s broken between two steps. It won’t tell you whether it’s a confusing checkbox, a slow-loading field, or a button that looks clickable but isn’t, and guessing costs you a sprint every time you get it wrong.
Livesession pairs conversion funnels with session replay, heatmaps, and error tracking in one dashboard, so once your funnel chart flags a leak, you can watch the actual sessions where people hit it. Integrations with Intercom, Zendesk, Shopify, and Segment mean you’re not rebuilding your event pipeline to get there, and privacy controls built for GDPR and CCPA keep sensitive fields masked automatically.
A useful way to start: pick your worst-performing stage from this week’s funnel chart, pull ten recent sessions where users dropped off there, and watch them back to back. Most teams find the root cause inside the first five recordings. Start a trial with Livesession and run that diagnostic sprint on your own funnel this week.
Sources
Related articles



Get Started for Free
Join thousands of product people, building products with a sleek combination of qualitative and quantitative data.