
8 Best Product Analytics Tools 2025 List

Introduction to Product Analytics Tools
In today's data-driven world, understanding how users interact with your product is crucial for success. Product analytics tools provide insights into user behavior, helping businesses make informed decisions to improve their products and drive growth. As we look ahead to 2025, the landscape of product analytics tools continues to evolve, offering more advanced features and capabilities. In this guide, we'll explore the top product analytics tools available, helping you choose the right one for your needs.
How We Evaluate and Compare Product Analytics Platforms
To provide a comprehensive comparison, we evaluated each tool based on the following criteria:
- Best For: The specific use case or audience the tool is most suitable for.
- G2 Ratings: User satisfaction scores and common feedback from G2 reviews.
- Key Features: The main functionalities and capabilities of the tool.
- Pricing Information: Starting prices and availability of free trials.
- Pros and Cons: The advantages and limitations of each tool.
List of the Best Product Analytics Tools for 2025
Some of the best product analytics tools selected for 2025 are
Best Product Analytics Software Comparison
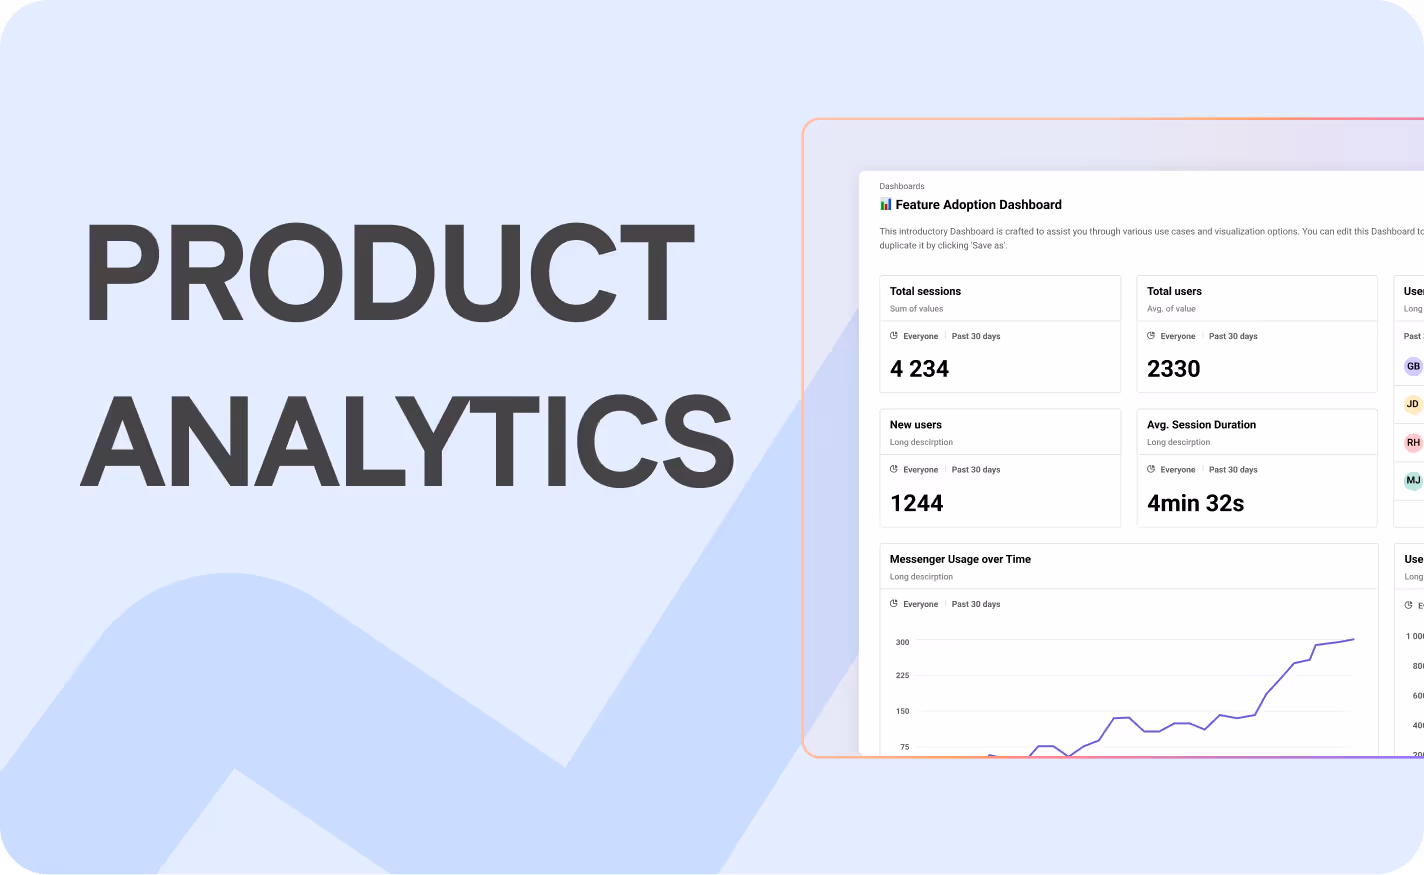
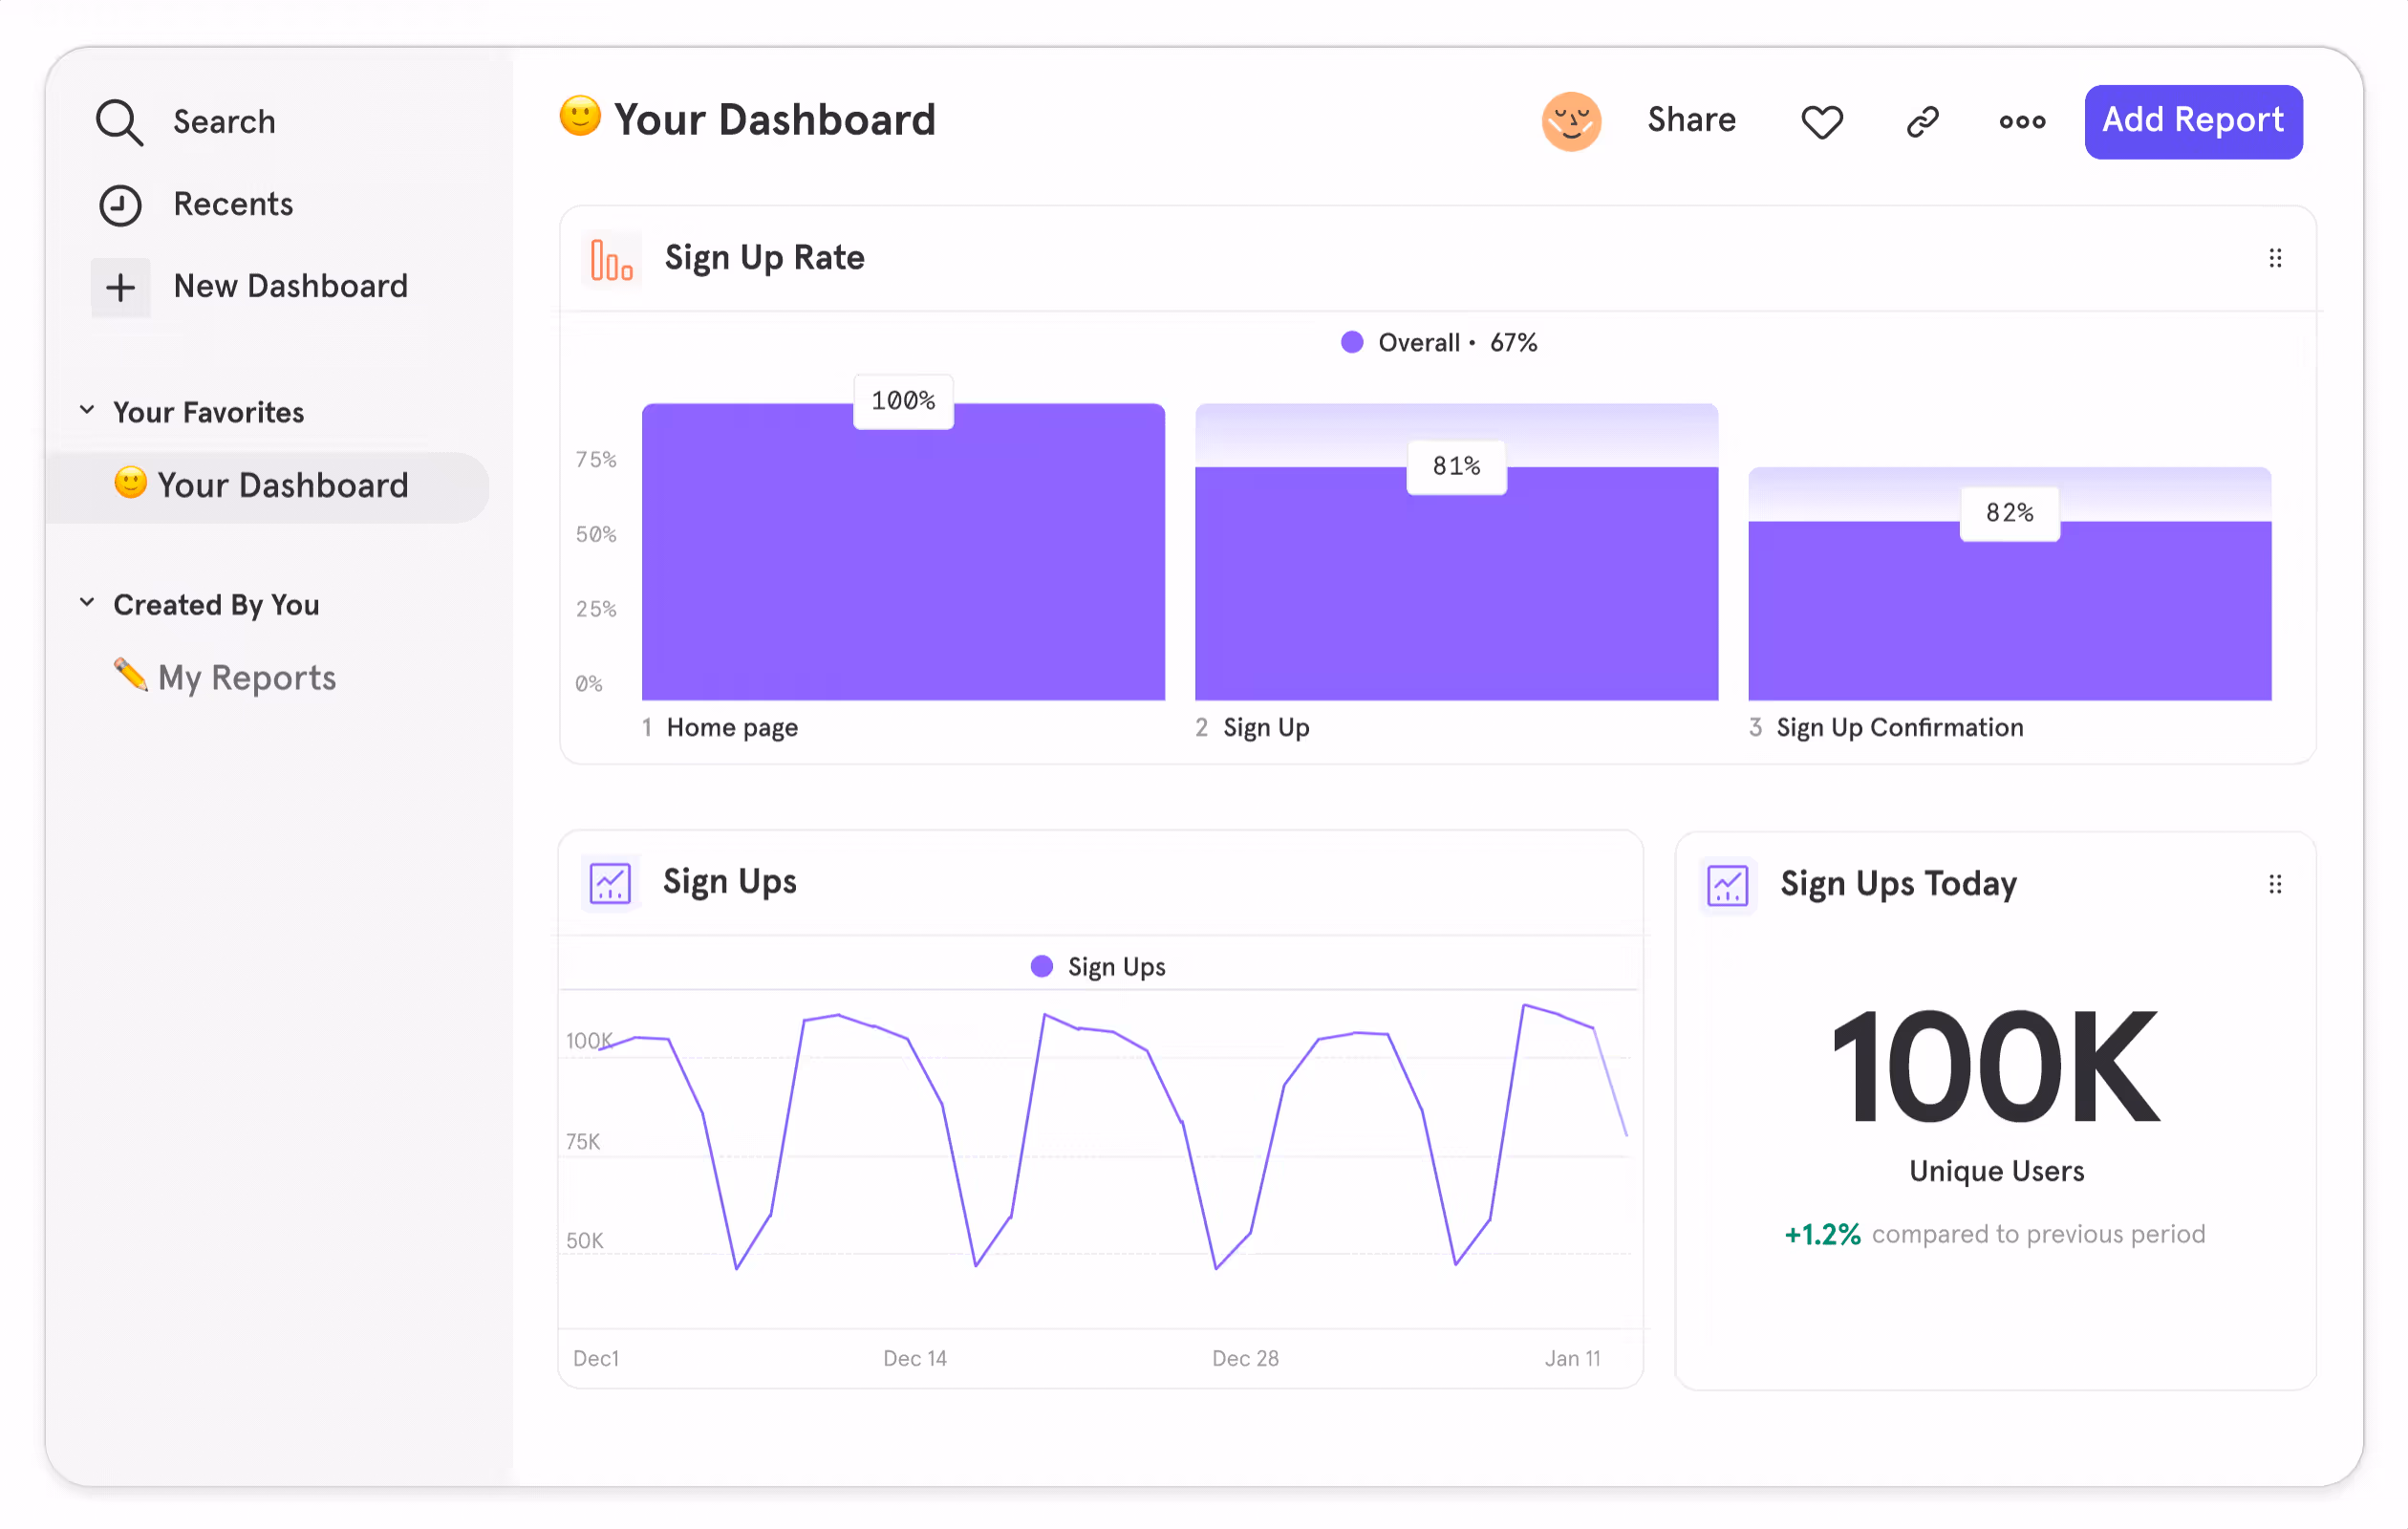
LiveSession - Best for professional product teams seeking rapid, actionable insights and robust session tracking without fuss.
Best for
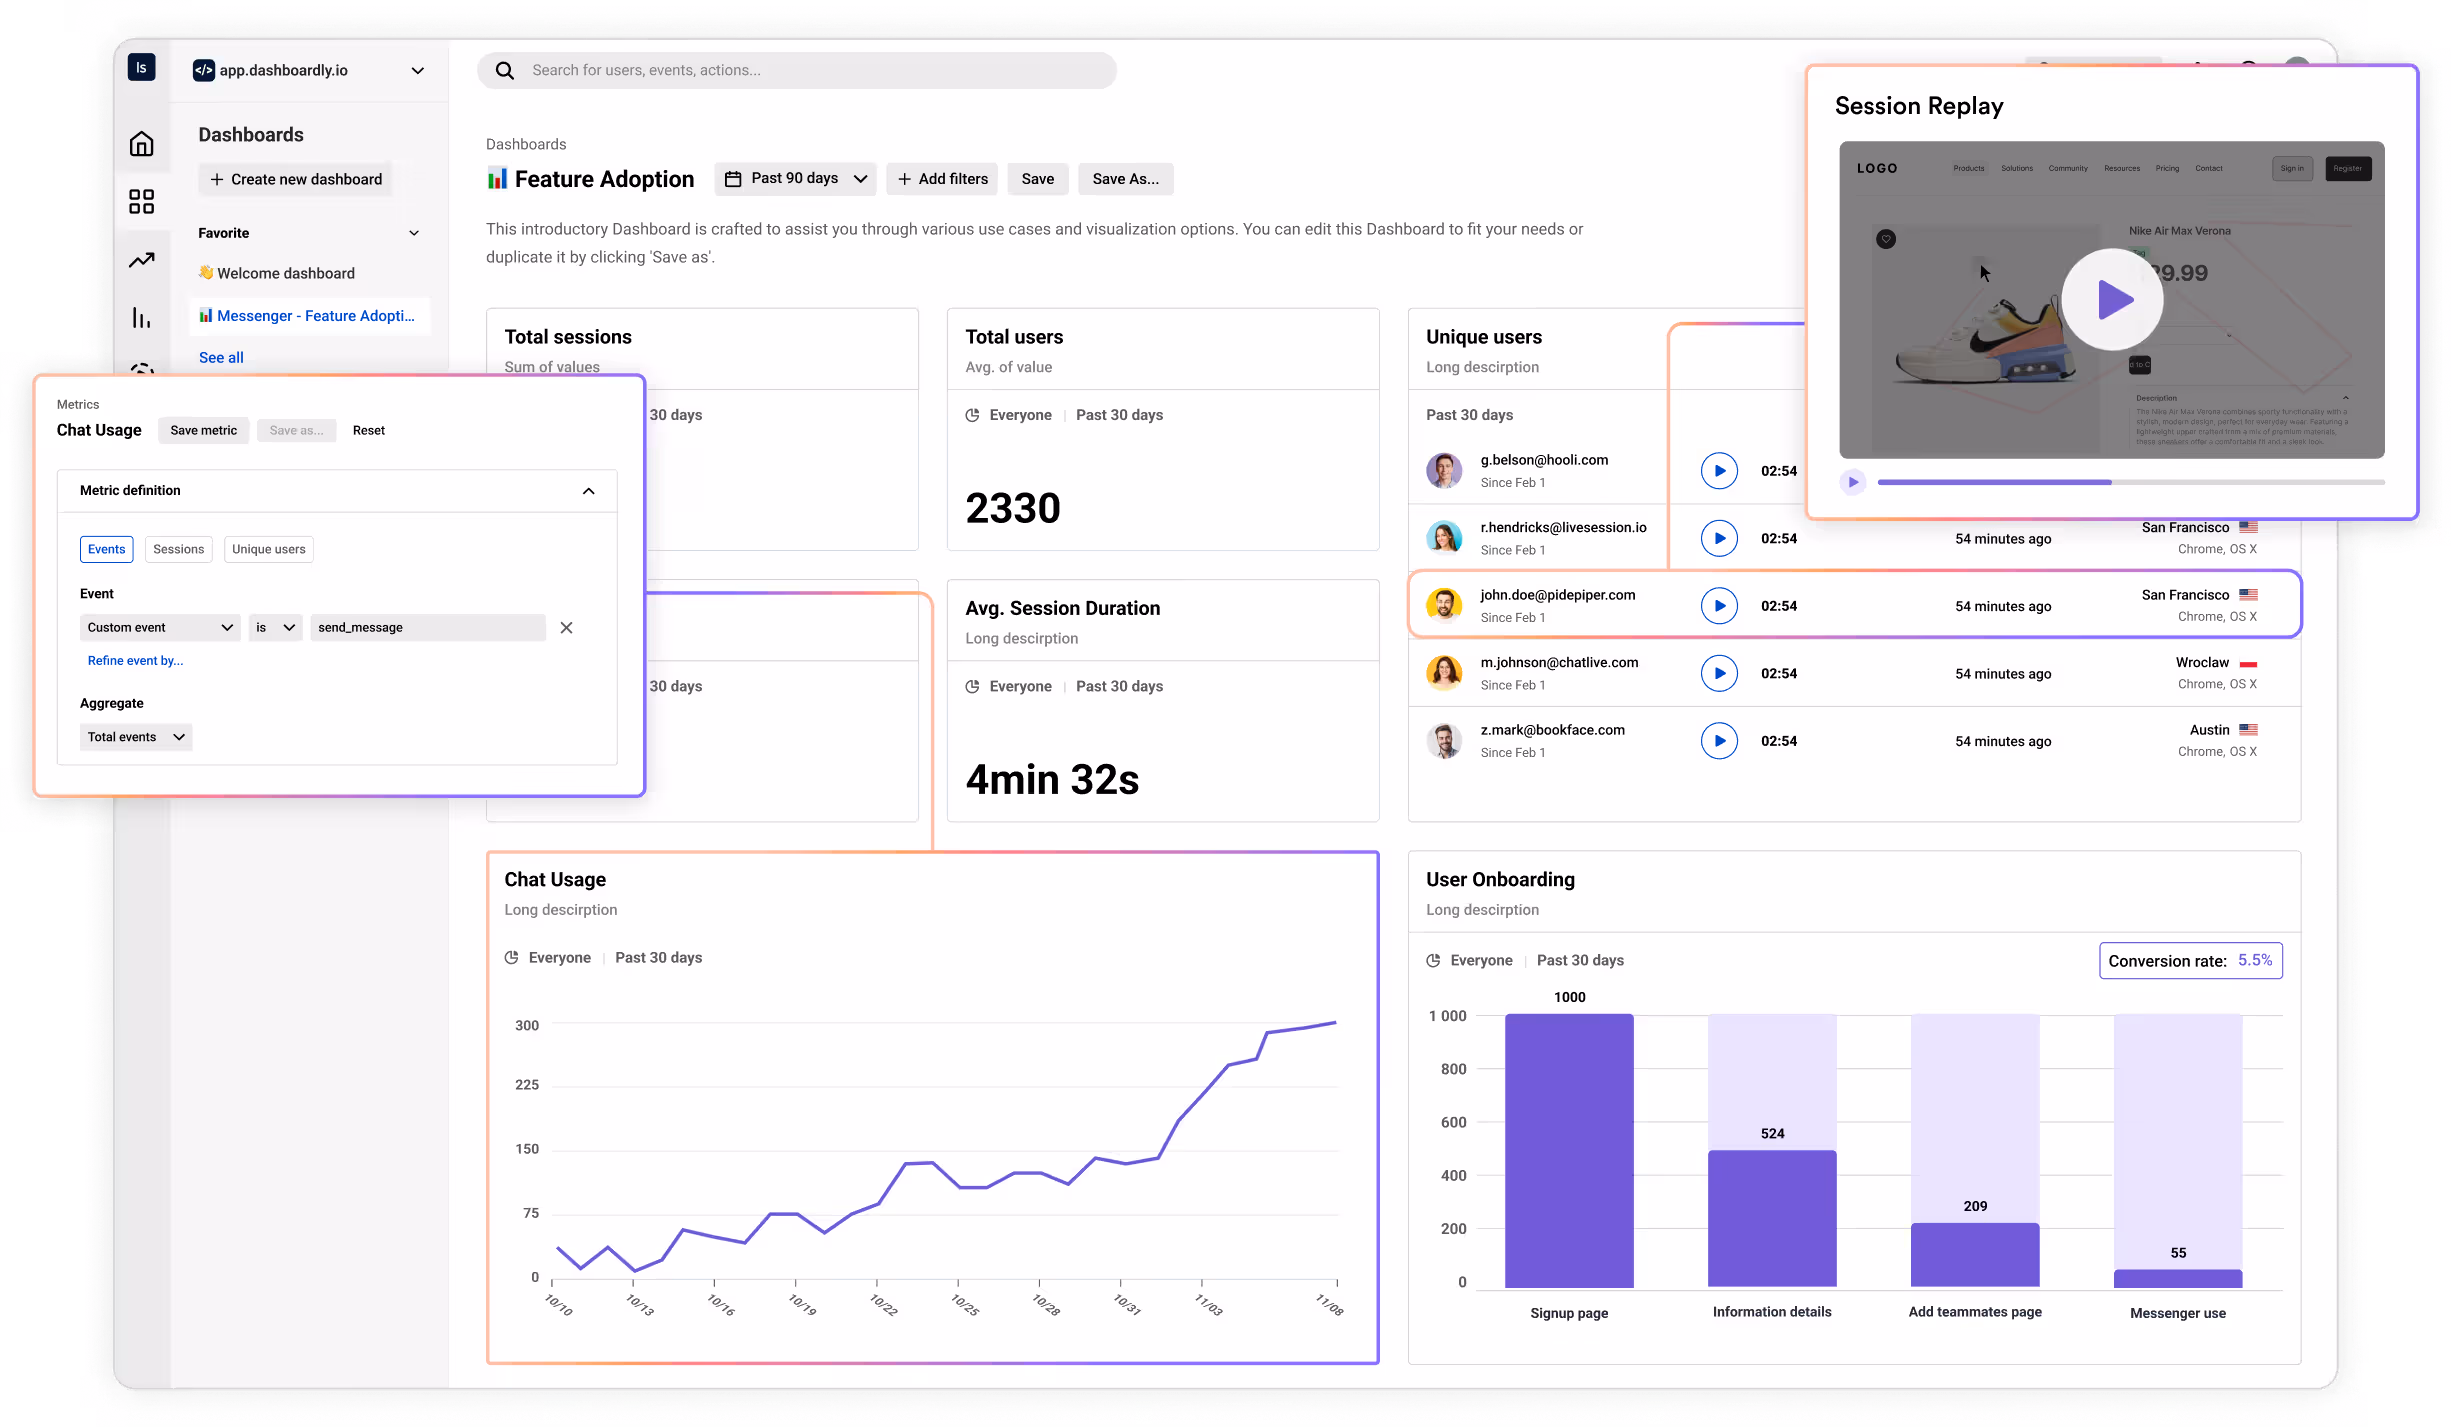
LiveSession is a digital analytics platform tailored for professional teams that seek rapid, actionable insights into user behavior and robust session tracking without unnecessary complexity. Its intuitive interface allows product managers and designers to analyze user journeys efficiently, making it suitable for teams focused on optimizing product performance and enhancing the overall product experience.
G2 Ratings
With a G2 score of 4.6/5, LiveSession garners positive feedback for its value, ease of use, and sleek user interface. Users appreciate its ability to deliver quick insights into product usage. However, some have noted limitations in advanced features that larger analytics platforms offer, which may hinder deeper analysis for more complex products.
Key Features
- Session Replays: Enables teams to observe user behavior directly, providing valuable insights into the user journey.
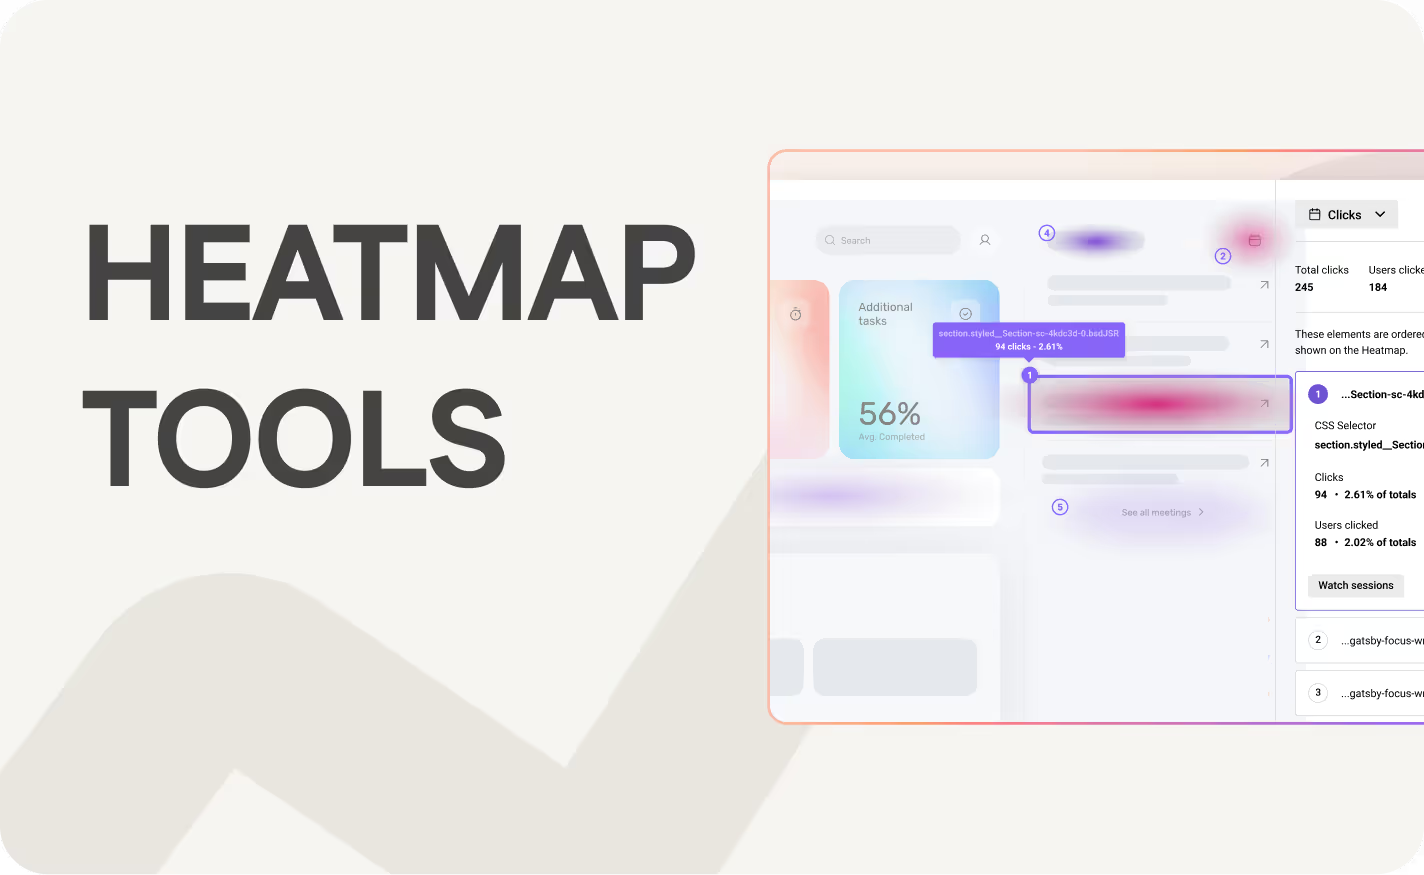
- Heatmaps: Visual representations of interaction hotspots help product teams understand where users engage most effectively.
- Custom Dashboards: Streamline analytics capabilities, allowing teams to tailor data visualization to their specific needs.
Pricing Information
- Starting at $65 per month
- LiveSession offers a free plan for users to get started, while paid options begin at $65 per month. A 14-day free trial is available, allowing users to explore its features before committing financially.
Pros and Cons
- Pros: LiveSession provides fast insights, a sleek user interface, and cost-effective solutions for product analytics.
- Cons: It lacks some advanced features found in larger analytics platforms, which may limit its effectiveness for more complex product development and analytics needs.
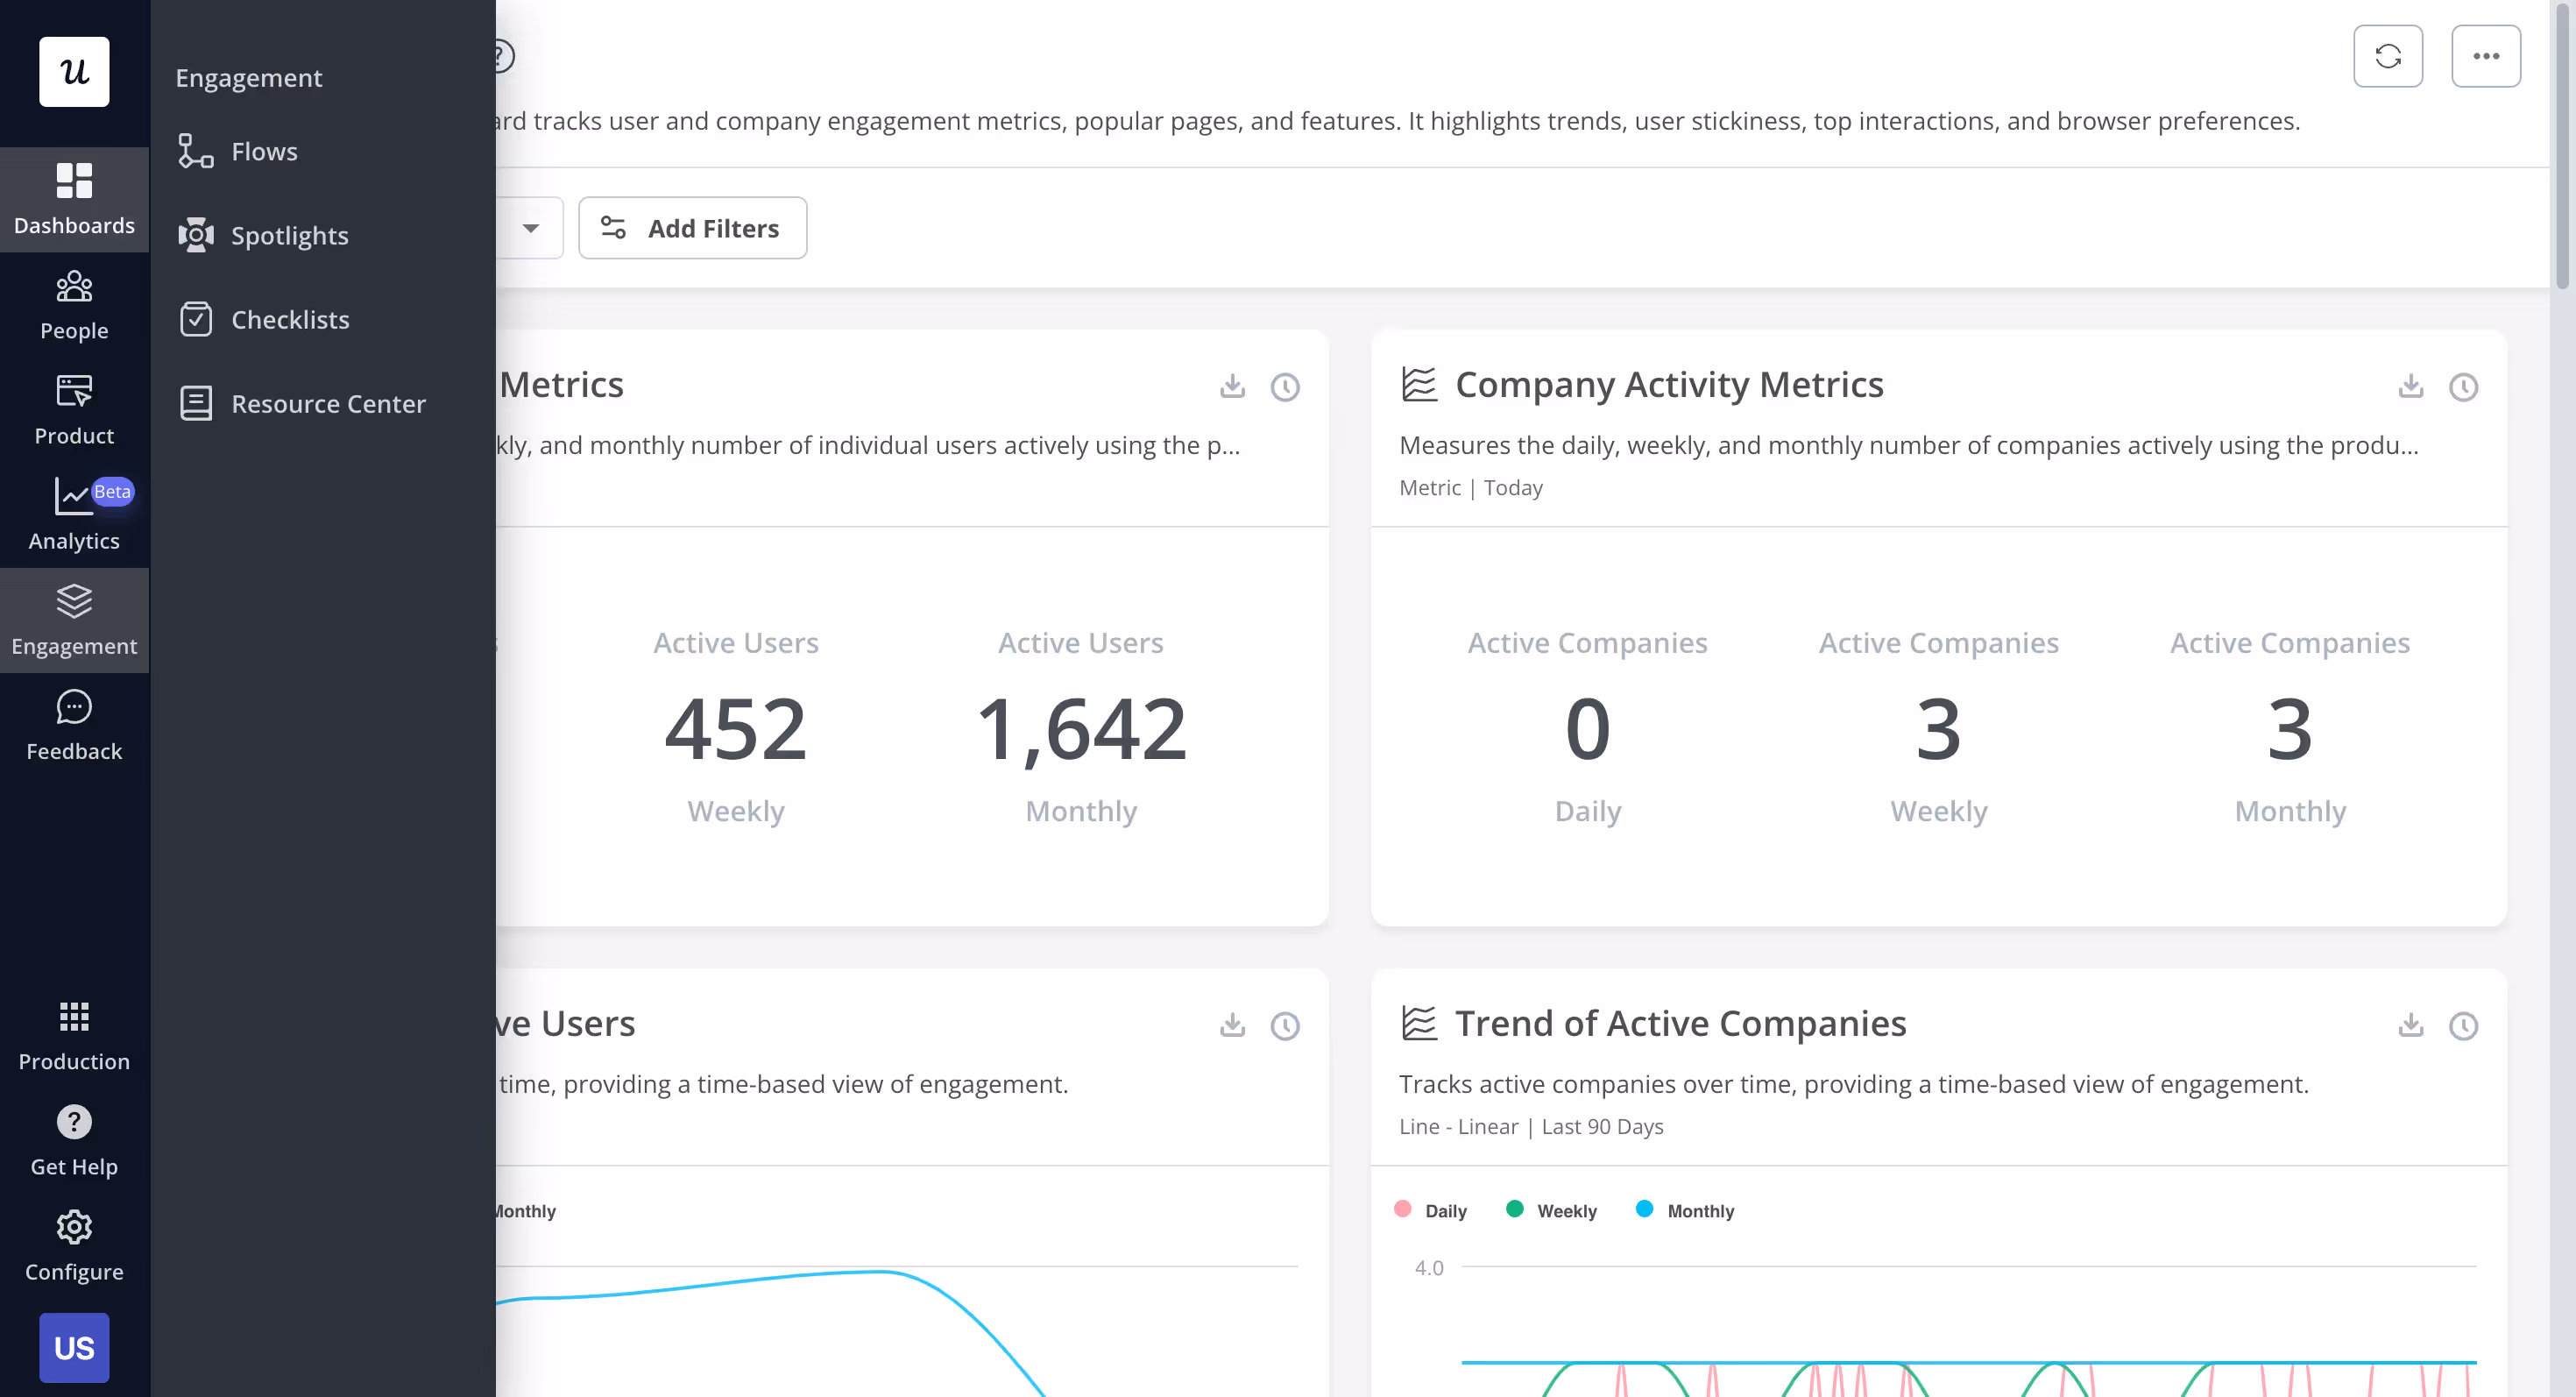
Userpilot - Best for product and growth teams looking to track growth goals and improve product performance.
Best for
Userpilot is a product experience platform designed specifically for growth teams and product managers aiming to track growth goals and enhance user engagement. Its primary audience includes product teams looking to optimize product adoption and improve user journeys through actionable insights derived from user data.
G2 Ratings
With a G2 score of 4.6/5, Userpilot is generally well-regarded for its strong focus on conversion and user engagement. However, users have voiced concerns regarding its steep learning curve and performance issues, particularly high-load page slowdowns that can impede user experience.
Key Features
- Retroactive Event Capture: Simplifies tracking of user interactions, allowing teams to analyze product usage without extensive pre-planning.
- In-App Surveys: Facilitates the collection of direct user feedback, enabling product teams to gather insights on user experience and improve product performance.
- Localization: Enhances global reach by supporting multiple languages, making it easier for product teams to cater to diverse user bases.
Pricing Information
- Starting at $299 per month
- Userpilot offers a free trial, allowing potential users to explore its features before committing. Paid plans start at $299 per month for up to 2,000 users, which can be a significant investment for startups.
Pros and Cons
- Pros: Userpilot boasts strong conversion tools and a UI-focused design that assists product teams in making informed decisions.
- Cons: The platform can be pricey for startups and may suffer from performance issues that could detract from the overall product experience.
In conclusion, while Userpilot presents powerful analytics capabilities to help product teams track and optimize their growth goals, potential users should weigh the costs against its limitations.
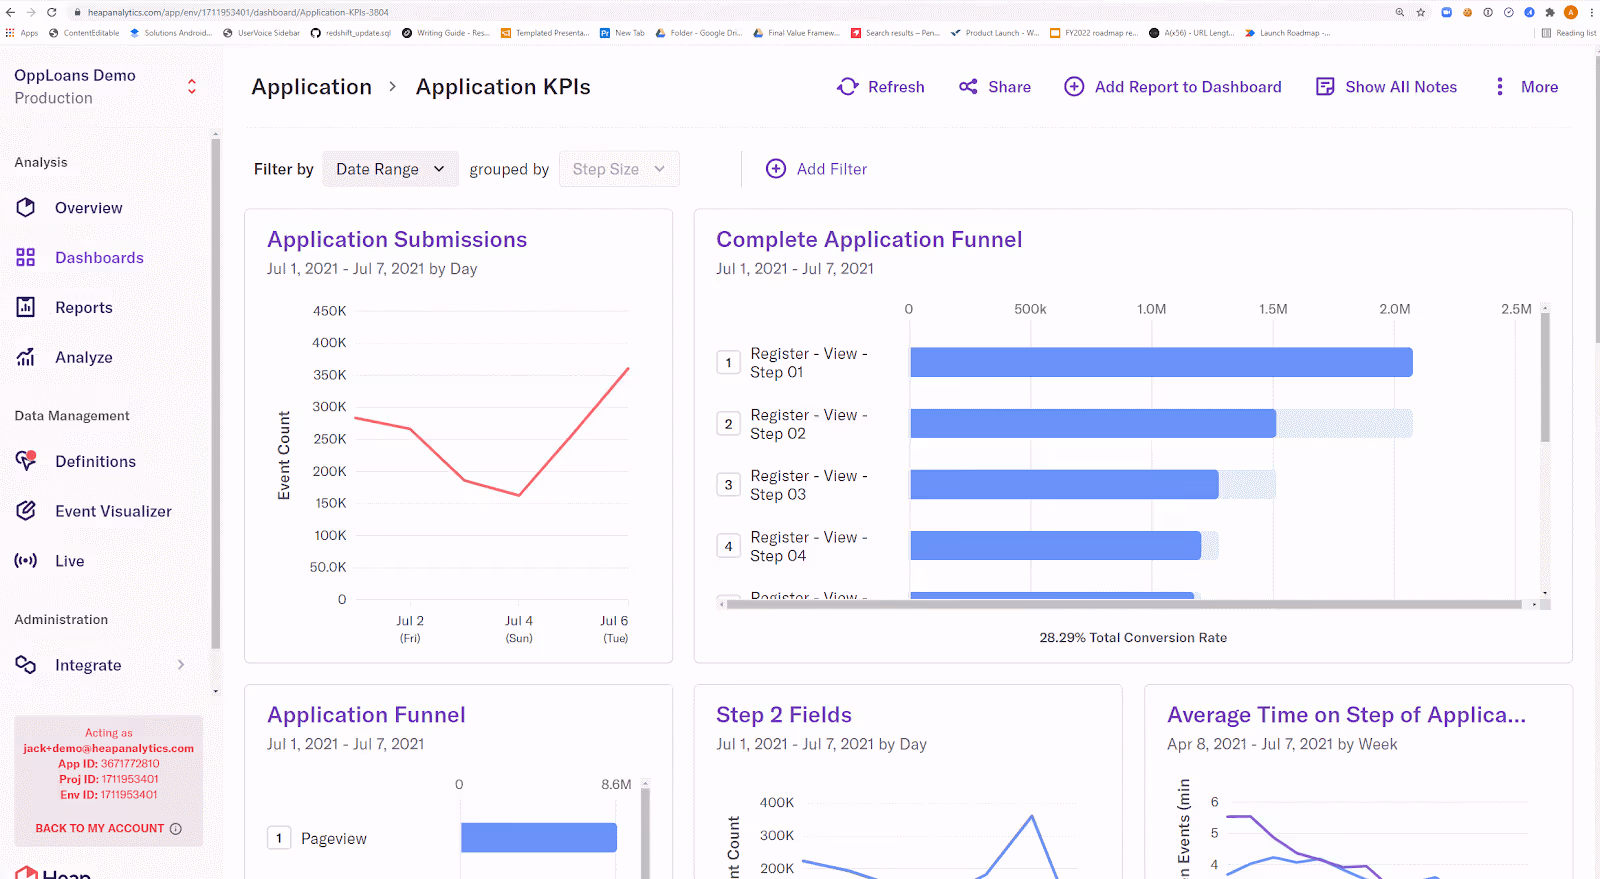
Heap - Best for teams seeking automatic analytics without pre-defined events.
Best for
This tool is mostly used for automatic analytics without the burden of setting up predefined events. It streamlines the process of gathering user data, making it suitable for product managers and teams focused on enhancing user experience and product performance.
G2 Ratings
With a G2 score of 4.4/5, users appreciate its auto-capture feature, which simplifies analytics capabilities. However, the UI lag and unclear pricing structures have led to frustration among users, diminishing overall user sentiment.
Key Features
- Event Autocapture: Automatically collects data without manual setup, saving time for product teams.
- Cohort Analysis: Allows grouping of users to understand different user journeys and behaviors effectively.
- Data Enrichment: Adds contextual information to user data, enhancing the ability to analyze product usage and improve decision-making.
Pricing Information
- Free plan available
- The software offers a free plan, which is a notable feature for smaller teams. However, detailed pricing information is not publicly available, and users face session limits that may hinder scalability.
Pros and Cons
- Pros: Quick setup enables rapid deployment; retroactive analysis provides valuable insights into past user interactions.
- Cons: Users report significant UI lag, opaque pricing structures can create confusion, and session limits may restrict comprehensive data gathering.
In conclusion, while this product analytics platform offers powerful tools for automatic analytics, potential users should weigh these pros and cons carefully before committing to help optimize their product development.
Mixpanel - Best for skilled product teams requiring advanced analytics and customization.
Best for
Mixpanel is a powerful product analytics platform designed specifically for skilled product teams that require advanced analytics and extensive customization. Its typical audience includes product managers and data analysts who are focused on improving the product experience through deep user insights and tailored metrics.
G2 Ratings
Mixpanel holds a G2 score of 4.6/5, reflecting overall positive user sentiment, particularly for its flexibility and robust analytics capabilities. However, users often point out a long learning curve and complex pricing structure as significant drawbacks, making it less accessible for less experienced teams.
Key Features
- Custom Dashboards: These allow teams to tailor metrics to their specific needs, enabling more focused analysis and decision-making based on user data.
- Funnels: These track conversions effectively, providing insights into product usage that can help product teams optimize their offerings using product analytics.
- User Journeys: This feature visualizes paths taken by users, enabling product managers to better understand user experiences and identify areas for improvement.
Pricing Information
- Starting at $140 per month
- Mixpanel offers a free plan, making it easier for new users to explore its capabilities. Paid plans start at $140 per month for 1.5 million events, which may escalate as data needs grow.
Pros and Cons
- Pros: Highly customizable and scalable, making it an ideal choice for product teams needing detailed analytics help.
- Cons: Mixpanel’s steep learning curve and potentially escalating costs make it challenging for smaller teams or those new to product analytics.
In the competitive landscape of digital analytics platforms, teams should weigh these factors carefully when considering Mixpanel as their ideal product analytics solution.
Pendo - Best for companies looking to improve software experiences with in‑app guides and analytics.
Best for
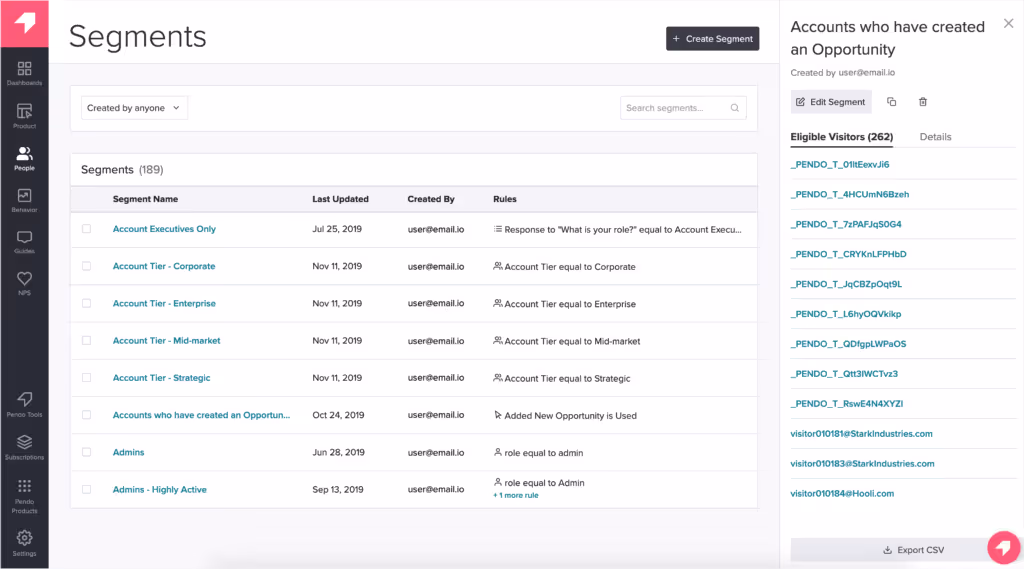
Pendo is a powerful product analytics platform designed for companies seeking to enhance their software experiences through in‑app guides and analytics. Its primary audience includes product managers and teams focused on optimizing user journeys, improving product adoption, and analyzing user data for better decision‑making.
G2 Ratings
With a G2 score of 4.4/5, Pendo is generally well‑regarded for its all‑in‑one capabilities. However, users frequently cite complaints about its complex user interface and inadequate customer support, which can hinder effective use.
Key Features
- In‑App Guides: These facilitate onboarding, helping users navigate the product effectively and enhancing their overall product experience with the right product analytics.
- Net Promoter Score (NPS): This feature measures user satisfaction, providing insights into product performance and customer loyalty.
- Session Replays: By revealing user behavior, session replays allow teams to analyze product usage and identify areas for improvement.
Pricing Information
- starting at $xx per month
- Pendo does not publicly disclose its pricing, requiring interested users to contact sales for details. This lack of transparency can be a hurdle for potential customers assessing budgetary fit.
Pros and Cons
- Pros: Pendo is comprehensive for product managers, offering versatile analytics capabilities that can significantly aid in product development and optimization.
- Cons: The complex UI can be daunting and may not be beginner‑friendly, with some users experiencing subpar support that complicates the learning curve.
In summary, while Pendo offers valuable tools for enhancing the product experience, potential users should weigh its advantages against its shortcomings.
Amplitude - Best for enterprise teams needing advanced analytics and experimentation tools.
Best for
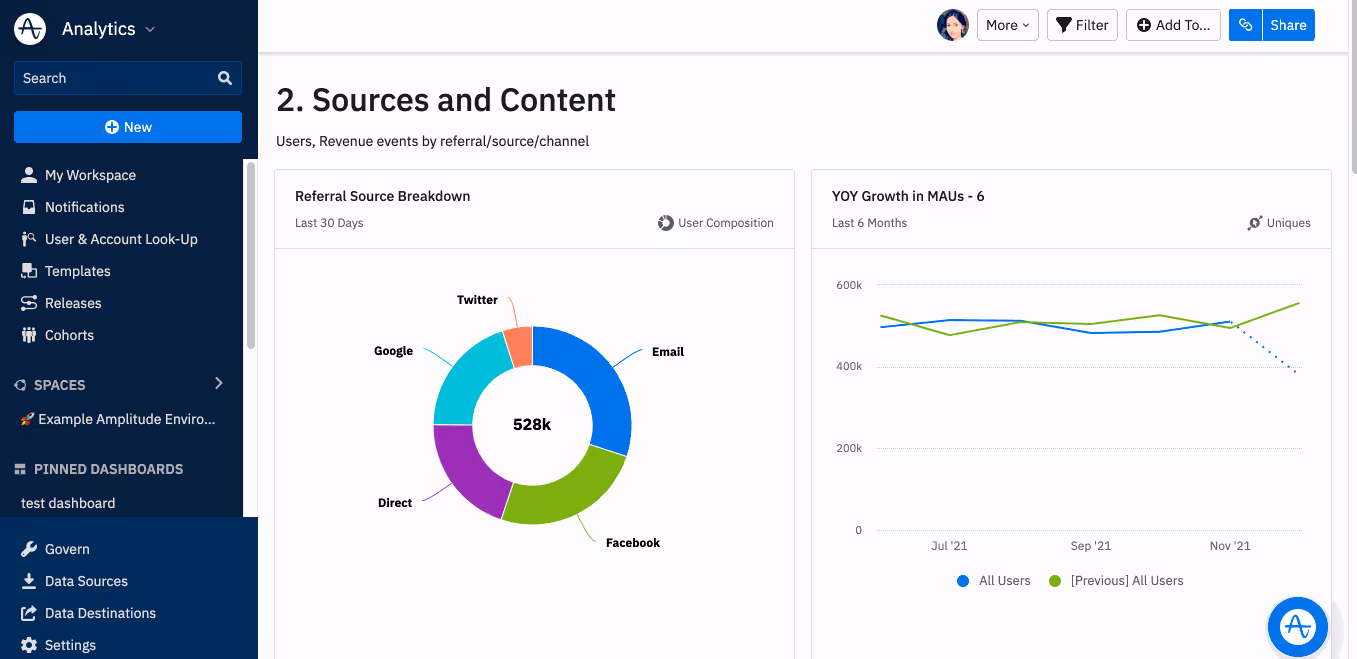
Amplitude is designed for enterprises seeking scalable web analytics and advanced experimentation tools. Its typical audience includes product management teams that require deep insights into user behavior within their digital products. This platform is particularly beneficial for organizations needing robust data analytics to inform strategic decisions and optimize user experience.
G2 Ratings
Amplitude holds a G2 score of 4.5/5, reflecting its strong reputation among users who praise its scalability and comprehensive features. However, a common complaint is the steep learning curve associated with the platform, alongside limitations in chart customization that can hinder effective product analytics.
Key Features
- Feature Flags: Manage product releases effectively, allowing for controlled rollouts and minimizing risk.
- Advanced Dashboards: Deepen insights into user behavior, enabling teams to make data-driven decisions.
- Experimentation Tools: Facilitate hypothesis testing, empowering product teams to validate ideas before full implementation.
Pricing Information
Amplitude's pricing starts at $61 per month for 1,000 Monthly Tracked Users (MTUs). While it offers a comprehensive suite of features, potential users should note that no free trial is available, which limits initial engagement with the product.
Pros and Cons
Pros: Amplitude excels in scalability and offers robust experimentation tools, providing valuable product analytics help for enterprise teams.
Cons: The platform's high learning curve can deter new users, and the limitations in chart customization may restrict the effectiveness of data analytics to understand user behavior fully.
Fullstory - Best for enterprises needing comprehensive digital experience insights.
Best for
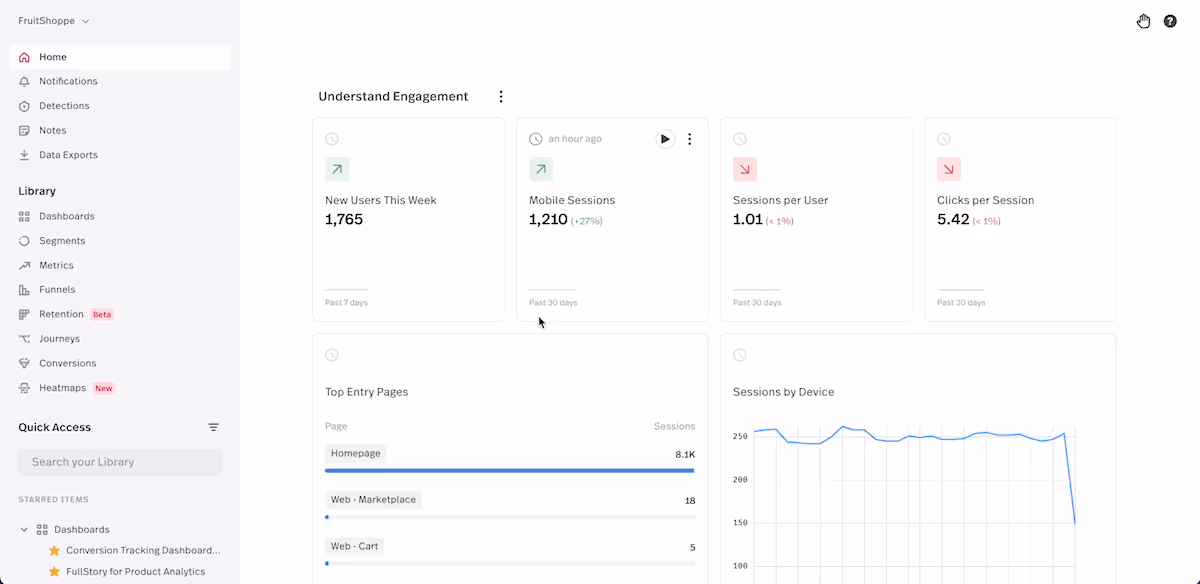
Fullstory is a robust digital experience analytics tool designed for enterprises that require in‑depth insights into user interactions. It is particularly beneficial for large organizations looking to optimize their digital interfaces and enhance customer engagement through detailed product analytics.
G2 Ratings
With a G2 score of 4.5/5, Fullstory is generally well‑received; however, users often voice concerns regarding its steep pricing and the complexity of its onboarding process. This feedback highlights the challenges that can arise when integrating it into existing systems.
Key Features
- Session Replays: Capture user interactions in real time, allowing teams to understand how customers navigate the product.
- Heatmaps: Visualize user engagement hotspots, providing valuable insights into where users focus their attention.
- Behavior Analytics: Identify trends and patterns in user behavior, aiding product teams in making informed product decisions based on actual usage data.
Pricing Information
- Pricing details for Fullstory are not publicly available, which can lead to frustration for potential users. However, a free trial is offered, allowing businesses to explore its capabilities before committing.
Pros and Cons
- Pros: Fullstory is exceptionally comprehensive, making it a valuable asset for large organizations seeking deep digital experience insights.
- Cons: The hidden pricing, lengthy onboarding process, and lack of suitability for small to medium‑sized businesses can be significant drawbacks, discouraging potential users from fully leveraging its capabilities.
Posthog - Best for technical teams who want full control and open‑source flexibility.
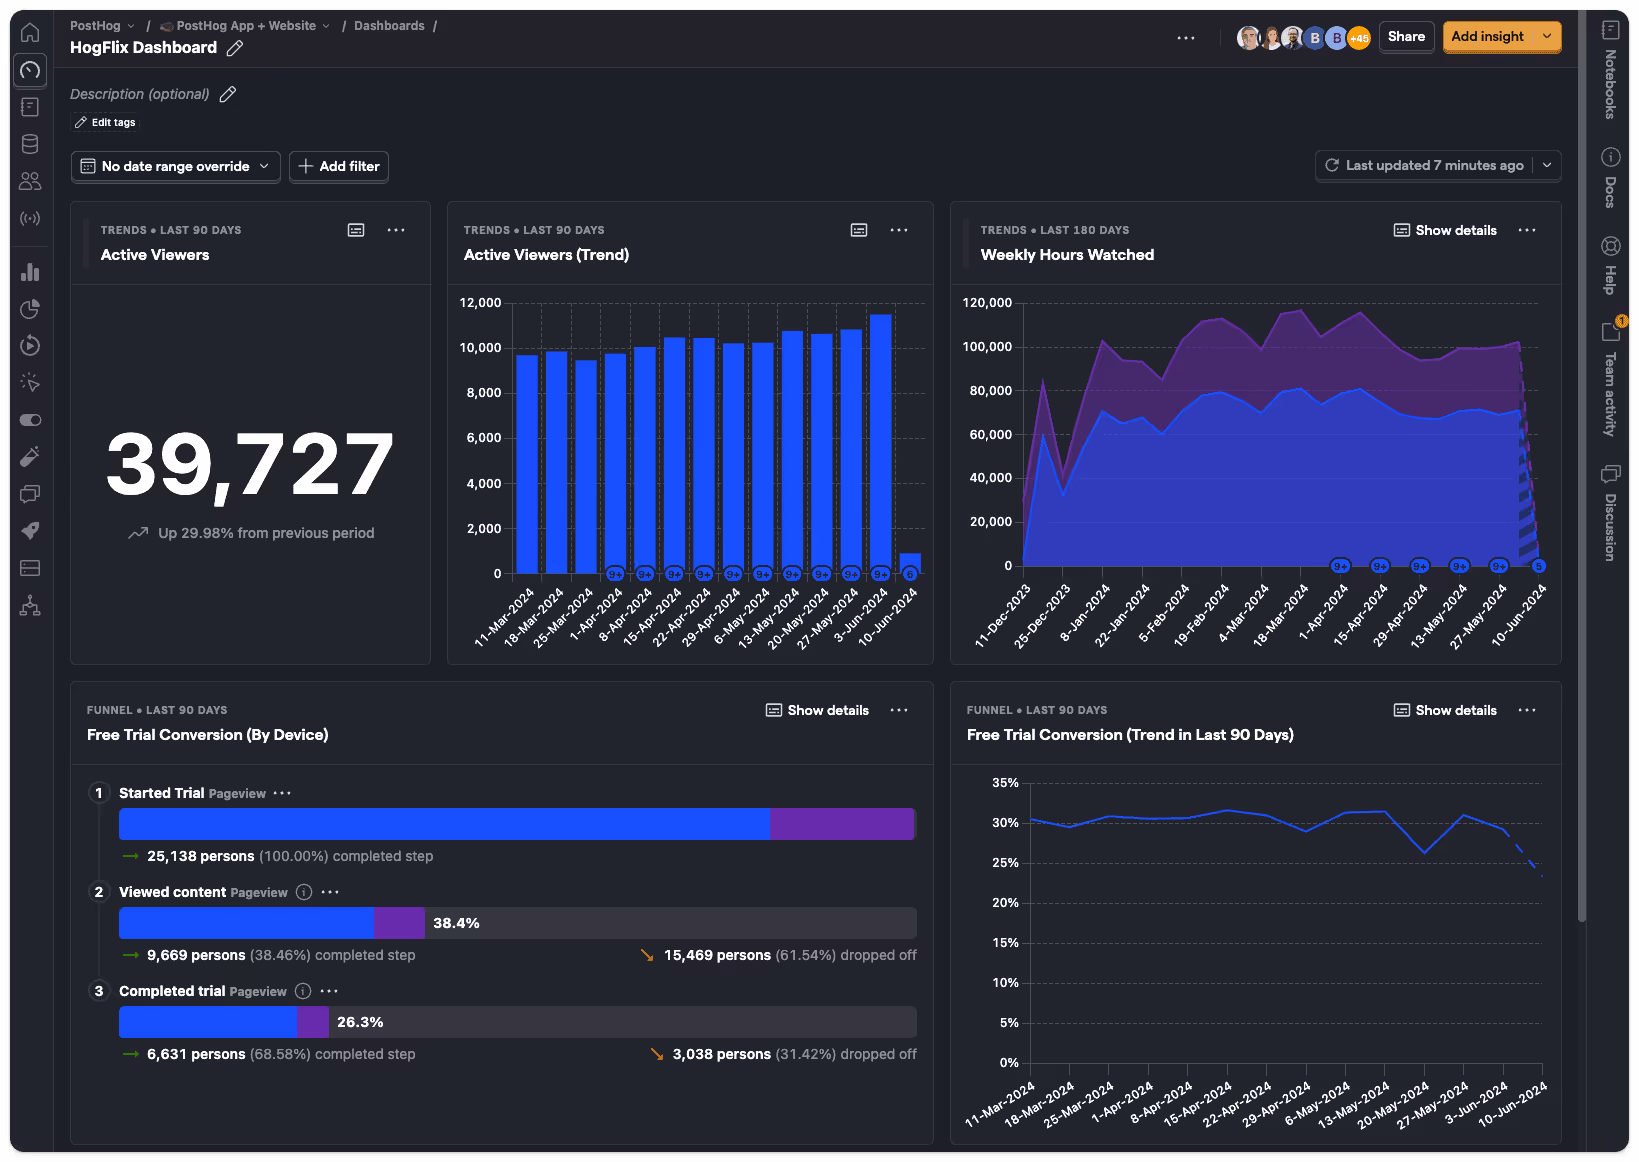
Best for
Posthog is an open‑source web and product analytics tool designed for technical teams that prioritize control and flexibility. It is particularly suited for organizations that require deep customization and wish to self‑host their analytics environment. This makes it an ideal choice for product people who need to leverage product analytics data effectively to drive informed product decisions and use the product efficiently.
G2 Ratings
Posthog currently holds a G2 score of 4.4/5, reflecting a generally positive sentiment among its users, particularly those with technical backgrounds. However, common complaints include confusion surrounding pricing structures and challenges related to data migration, which can hinder the user experience in using the product.
Key Features
- Self‑hosting Offers Control: Provides complete oversight of data, allowing teams to manage their own servers and data privacy.
- A/B Testing Optimizes Features: Enables experimentation and fine‑tuning of product features, helping product teams understand user preferences.
- SQL Querying Enables Custom Analysis: Users can write SQL queries for bespoke analytics, allowing for tailored insights that standard tools may not provide.
Pricing Information
- starting at minimum of $50 per month
- Posthog offers a free tier that supports up to 1 million events, after which the pricing shifts to $0.00005 per event. This tiered model can be appealing but may lead to unexpected costs as usage scales.
Pros and Cons
- Pros: Highly customizable and open‑source, allowing for extensive flexibility in setting up a business intelligence tool for product analytics.
- Cons: The complex pricing structure can be confusing, and the platform typically requires a higher level of technical expertise compared to other tools like Google Analytics.
Related articles


Get Started for Free
Join thousands of product people, building products with a sleek combination of qualitative and quantitative data.