
Platform for Analytics: How to Choose One for Your Product

An analytics platform is a single system that collects data, prepares it, analyzes it and shows the results, so a team does not have to stitch together separate tools for each step. For a product team, the useful version also shows what users actually did inside the product and why they got stuck. This guide explains what these platforms are, which kinds exist, what to check before you buy, and where session-based analytics fits.
What an analytics platform is
The term covers a wide range of software, which is why search results for it mix very different products: enterprise data science suites, business intelligence dashboards, free web traffic tools and product analytics services. What they share is scope. A fully integrated cloud analytics platform handles ingestion, transformation, analysis, storage and visualization inside one hosted system, where modular tools each cover only one of those steps.
That difference matters in practice. A single tool, such as a charting library or a standalone survey app, does one job and leaves the rest to you. A platform takes responsibility for the pipeline from raw events to a decision-ready view. A data warehouse, by contrast, mainly stores and organizes data. You still need something on top of it to ask questions and share answers.
For most product teams the real question is not “which platform is the most powerful?” It is “which one answers the questions we ask every week, with the least engineering effort?”
The main kinds of analytics platforms
The category splits by the kind of question each type answers. Here is a practical map.
| Type | Main question it answers | Typical users | Data it works on |
|---|---|---|---|
| Business intelligence | How is the company performing? | Finance, operations, leadership | Transactions, contracts, company records |
| Web analytics | Where does traffic come from and what does it do on pages? | Marketers, content teams | Page views, sessions, campaigns |
| Product analytics | What do users do inside the product? | Product managers, designers | In-product events and user paths |
| Data science and engineering platforms | What can we model, predict or automate? | Analysts, data engineers | Large, varied datasets |
| Session-based behavioral analytics | What did this user see and where did they struggle? | Product, UX, support, developers | Session recordings, clicks, errors |
These are not rivals so much as layers. Business intelligence reports on company records, product analytics records actions inside the product, and user research explains why people acted the way they did. Most mature teams use more than one layer, and the trick is to avoid paying twice for the same data.
If you want to go deeper on the product layer, our guides to product analytics and behavioral analytics cover methods and metrics in detail. For the website side, see our overview of web analytics.
The four types of analytics and what they mean for product decisions
People also ask what the four types of analytics are. They are descriptive (what happened), diagnostic (why it happened), predictive (what will happen) and prescriptive (what action to take). Gartner describes them as moving from reporting past trends toward anticipating outcomes and specifying or automating action. Gartner also suggests building a portfolio of analytical capabilities rather than leaning on one style, because the layers work best in combination.
Here is how each plays out for a product team:
-
Descriptive: weekly active users, activation rate, and how many people finished onboarding last month.
-
Diagnostic: why a signup step loses a third of visitors. This is where funnels, heatmaps and session replays earn their keep.
-
Predictive: which accounts look likely to churn based on their recent behavior.
-
Prescriptive: which change to ship next, or an automated nudge for users who stall.
A 2026 scoping review reported that adopting these analytical types is associated with efficiency gains of up to 35% in sectors such as healthcare and retail. Treat that as a signal that the practice pays off in general, not as a forecast for your own product. Results depend heavily on data quality and on whether people act on the findings.
Most product teams spend their time in the first two types. Knowing what happened is easy once events are tracked. Knowing why is where teams lose weeks, and it is the gap qualitative data fills.
What a platform should do for a digital product team
Whether you build, buy or combine tools, a product-focused platform should cover these jobs.
Track behavior without constant engineering requests
You need to see which features people use, in what order, and how often. Event-based analytics gives you the numbers. Look for automatic capture of clicks and page views, plus the ability to define custom events and filter by user properties such as plan or signup source.
Show the journey, not only the totals
A funnel tells you that 40% of users drop off at step three. It does not tell you why. The platform should let you jump from a funnel step to the sessions of people who dropped there, so the number turns into something you can watch.

Let you investigate friction directly
Session replay shows a user’s actual path: rage clicks, dead ends, form fields that confuse. Heatmaps show where attention and clicks concentrate across many visits. Error tracking connects a bug report to the exact session in which it happened, which shortens the back-and-forth between support and developers. Our own take on how to use replays efficiently is in testing one idea in 5 to 10 replays.
Fit the tools you already use
Analytics that live apart from your support desk, your store or your customer data pipeline get ignored. Check for integrations with the systems your team opens every day, so a replay link can sit inside a support ticket and events can flow in from your existing pipeline.

Give each role a useful view
Product managers want funnels and retention. Designers want to watch flows. Developers want errors with context. Marketers want to see how campaign traffic behaves after landing. A good platform offers shared dashboards, so the team argues about decisions rather than about whose spreadsheet is right. For a sense of how this looks in practice, see our product analytics dashboard.
Privacy, security and governance
Platforms that record behavior carry real responsibility, and this is the area where buyers most often under-check.
Regulators are paying attention to session replay in particular. France’s data protection authority published a draft recommendation in February 2026 noting that session replay can collect detailed browsing data, risk excessive collection and fail the proportionality test. The same document observes that the variety of business models among replay vendors may push publishers toward settings that capture more about users’ navigation than they need. The draft is French guidance, not a global rule, but it shows where scrutiny is heading, and many companies serving European users will care.
Practical checks before you sign:
-
Masking by default. Can the platform hide sensitive inputs such as passwords, payment fields and personal details before data leaves the browser?
-
Collection control. Can you exclude pages, elements or user groups, and limit what is recorded to what you need?
-
Retention settings. Can you choose how long recordings are stored and delete them on request?
-
Access control. Who on your team can watch sessions, and can you limit that by role?
-
Compliance posture. Does the vendor document how it supports GDPR and CCPA obligations, and will it sign a data processing agreement?
Governance is also an organizational matter. A 2026 review argues that successful analytics adoption needs strong leadership, data governance frameworks and organizational data literacy. In plain terms: decide who owns the event naming plan, who may add new tracking, and how people learn to read the dashboards. Our one-page measurement plan is a lightweight way to start.
How to choose: seven criteria that matter
Feature lists look alike. These criteria separate the platforms that get used from the ones that get abandoned.
-
The questions you ask most. Write down your ten most frequent product questions. A platform that answers eight of them without help from an analyst beats a more powerful one that answers all ten with a ticket to the data team.
-
Time to first insight. How long from adding the snippet to seeing real sessions and events? Days is fine. Weeks is a warning.
-
Qualitative and quantitative together. Numbers without context lead to guesses. Recordings without numbers lead to anecdotes. You want both in one place.
-
Integrations. Match them to your support, commerce and data stack.
-
Privacy controls. Use the checklist above and ask for specifics.
-
Pricing model. Usage-based pricing is easy to start and can grow quickly with traffic. Confirm what counts toward the limit, such as sessions, events or seats, and what happens when you cross it.
-
Who will use it. A tool built for analysts will sit unused by designers. Try it with the people who will open it weekly.
A simple way to run a trial
Pick one problem, such as a signup step that underperforms. Install the platform on a single product area. Give the team two weeks to answer a defined question, for example “why do users abandon the invite step?” At the end, judge the tool on whether the answer led to a change you shipped. If it did, you have your platform. If everyone just admired the dashboards, keep looking.
Our perspective
We build LiveSession for product teams, so we have a view on where analytics goes wrong. The most common failure is not a lack of data. It is a team that can see a drop in a chart and cannot see the reason, so the debate turns into opinions. Adding another metric rarely fixes that.
Our approach is to keep quantitative and qualitative evidence side by side. You spot the problem in a funnel or an engagement metric, then open the sessions behind it and watch what happened. That makes product meetings shorter, because a designer, a developer and a product manager can all look at the same thirty seconds of real behavior.
We also think privacy should be a starting condition, not a feature to add later. If your tool records people, you should be able to explain what it captures and why, and to limit it. Compliance with GDPR and CCPA is part of how we design the product, and we recommend any team to test those controls before rolling out to production.
Finally, small experiments beat grand analytics programs. Pick one hypothesis, watch a handful of replays, change one thing, and measure again. That habit teaches a team more than a large dashboard rollout does.
Where LiveSession fits
LiveSession combines session replay, heatmaps, conversion funnels, event-based analytics, error tracking and customizable dashboards in one product, with integrations for tools such as Intercom, Zendesk, Shopify and Segment. It is built for product managers, designers, developers, UX researchers and marketers who need to see both the numbers and the sessions behind them.
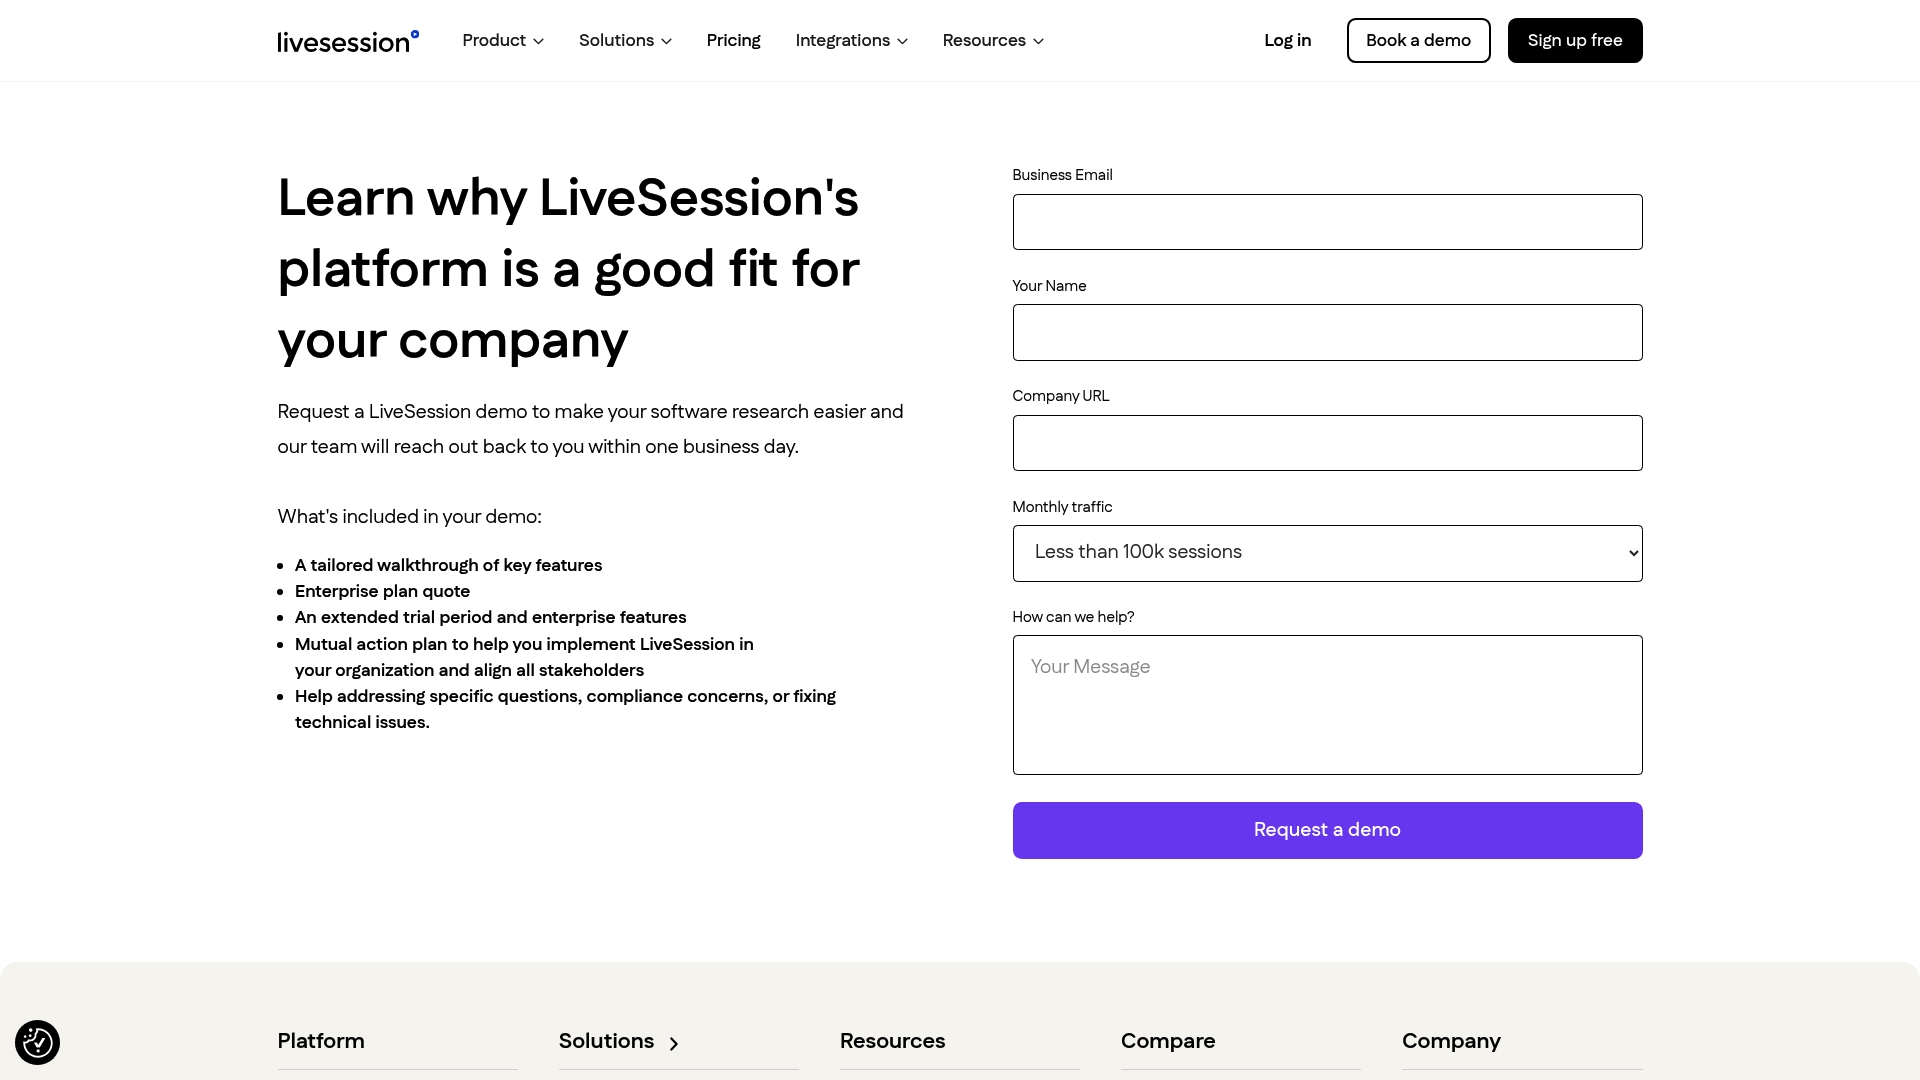
The plans are published on the pricing page: Free at $0 per year, Basic at $54 per year and Pro at $83 per year, with Enterprise available on request and no published price. You can start on the free plan and watch real sessions from your own product before deciding anything. If you want a visual starting point, our click map and heatmap tools show where attention goes on a page, and the features overview lists everything else.
Using analytics to inform content and growth
Product analytics is not only for product teams. Marketers who publish content gain from the same behavioral signals: which pages hold attention, where visitors leave, and what they do after a click. Understanding user behavior for content strategy is a natural complement to the product view, because it connects what people read to what they do next.
If your main need is website-level reporting rather than in-product behavior, start with our comparison of digital analytics tools for websites. For a deeper look at the experience side, our UX analytics course walks through the methods step by step, and the guide to behavioral product analytics metrics explains which numbers deserve a place on your dashboard.
Common mistakes when adopting a platform
-
Tracking everything. More events mean more noise and more privacy exposure. Track what supports a decision.
-
No naming convention. Six months later nobody knows whether “signup_done” and “registration_complete” mean the same thing.
-
Buying for the largest possible future. Choose for the team you have now, with a clear path to grow.
-
Ignoring support and engineering. Customer support and developers often get the fastest return from replays and error context, yet they are rarely included in the purchase.
-
Never closing the loop. If an insight does not produce a shipped change or a decision, the analytics is entertainment. Assign an owner to each finding.
FAQ
What are analytics platforms?
An analytics platform is software that brings data collection, processing, analysis and visualization into one system. Instead of using separate tools for each step, you work in one place that turns raw data into reports and answers. Some focus on business records, others on website traffic or in-product behavior.
How is a product analytics platform different from web analytics?
Web analytics focuses on traffic: where visitors come from and which pages they view. Product analytics focuses on what users do inside your application, such as which features they adopt and where they stall. Many teams use both, with web analytics for acquisition and product analytics for activation and retention.
What is the best website analytics platform?
There is no single best option, because it depends on your question. For traffic and campaign reporting, a general web analytics tool is usually enough. If you need to understand why visitors struggle on a page or in a flow, add heatmaps and session replay. Start by listing your most frequent questions, then test a platform against them.
Is session replay safe for user privacy?
It can be, if it is configured carefully. Regulators such as France’s CNIL have warned that replay can collect more than is needed, so mask sensitive fields, limit what is recorded, set retention periods and restrict access. Check that your vendor documents how it supports GDPR and CCPA, and ask your legal or privacy adviser to review your setup.
Can a small team use an analytics platform?
Yes. Small teams often benefit most, because they cannot afford long debates or a dedicated analyst. Start with one question, a free or low-cost plan and a short trial, and expand only when the first insight has changed something in your product.
Sources
Related articles



Get Started for Free
Join thousands of product people, building products with a sleek combination of qualitative and quantitative data.